Next: Research projects No:23-33
Up: Research
Previous: Research projects No:1-11
- Automated analysis of forest using high resolution CIR aerial images
Mats Erikson, Gunilla Borgefors
Funding: SLU S-faculty
Period: 9508-
Partners: Tomas Brandtberg, Dept. of Geology and Geography, West
Virginia University, Morgantown, USA; Kenneth Olofsson, Dept. of Forest Resource Management and Geomatics, SLU, Umeå
Abstract:
The main goal of the project is to develop methods for computerised
analysis of high spatial resolution remotely sensed data, i.e., digitised
aerial photographs and laser scanning data, and to use the results in
forestry and environmental assessment instead of (or as a complement to)
field visits by humans. A set of 50 research aerial images (digitised
colour-IR film), with resolution approximately 10 cm and 3 cm (flight
height 600 m, focal length 300 mm) to make the individual tree crowns
clearly visible is used. Interesting forest stand parameters to measure in
the images are: number and positions of trees, horizontal tree crown areas,
tree heights, and tree species composition. Features related to the
individual tree species are, e.g., colour, internal structure (texture),
and boundary structure.
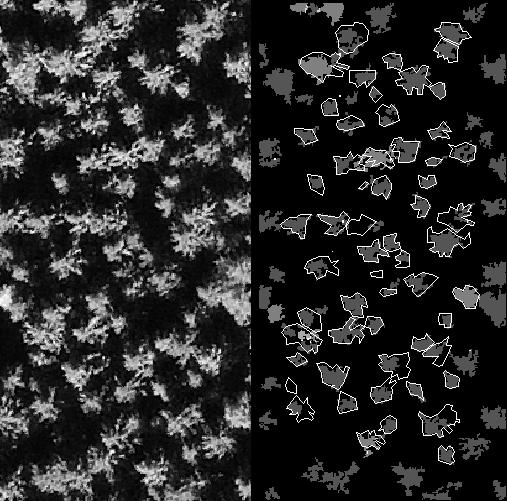
During 2001 a tree crown segmentation was developed. This year, this method
is being evaluated in a joint project with SLU, Umeå. They have developed
another type of method for detecting trees in images. Together we use new
(2002) aerial and field data to evaluate both methods against each other
and against ground truth. See Figure 8 for a small example of
the segmentation results. We have also developed a new segmentation method
based on Brownian motion. The method preserves the inner structure of the
tree crown in a much better way than the old ones and also finds the
contour of the crown in a better way. A method for classification of tree
species using, among other clues, the inner structure from the segmentation
method based on Brownian motion is in development.
Figure 8:
Left: Original tree image. Right: The result from the fuzzy segmentation
method together with manually delineated crowns using field data (white
polygons).
- Finding stems in young forests using horizontal laser scanning
Mats Erikson, Gunilla Borgefors
Funding: SLU S-faculty
Period: 0108-
Partners:
Karin Vestlund, Dept. of Forest Products and Markets, SLU
Abstract:
This is a pilot project on finding stems in horizontal laser images in the
forest. The goal is to investigate if data can be extracted from such
images to automatically select trees for cutting by a thinning robot. The
image analysis task is to locate and identify young trees in depth images
and also find various features to determine if the tree should be cut or
not.
- Automated segmentation of remotely sensed images over agricultural
fields
Anna Rydberg, Gunilla Borgefors
Funding: SLU JLT-faculty
Period: 9602-0112
Abstract:
In this project, multispectral segmentation methods for extraction of
remotely sensed features, especially borders, in agricultural fields were
developed. An increasing number of satellites, and other sensors, provide
more and more information, which creates a need for interactive or even
automated analysis of remotely sensed images. The key problem is almost
always segmentation. To achieve good segmentation, it is advantageous to
integrate several techniques. As the first step in our project, a
multispectral edge and line detector was developed. A region growing
procedure, which detects additional boundaries, followed this step. This
results in an over-segmented image, therefore segmentation was followed two
merging procedures, where one procedure merged small regions with similar
spectral characteristics, and one procedure merged regions according to
their shape. A priori knowledge about field shape and size should be taken
into account, if possible. This project resulted in Rydberg's PhD thesis,
defended in November 2001. This year, a book chapter the book ``Geospatial
Pattern Recognition'', describing the whole process, was published.
- New techniques for information extraction from hyperspectral crop
reflectance data
Hamed Hamid Muhammed
Funding: UU TN-faculty, Swedish National Space Board
Period: 0201-
Partners: Anders Larsolle, Dept. of Agricultural Engineering, SLU
Abstract:
Hyperspectral crop reflectance data can be used for studying the
pathological condition of the crop. The influence of pathological status of
a crop on its spectral characteristics is detectable in the visible and/or
the near-infrared regions of the electromagnetic spectrum. FVBA can be used
here to analyse and study the pathological condition of a crop, by taking a
reference or training data set consisting of hyperspectral data vectors and
the corresponding field measurements of the leaf-damage level in the
studied crop. Then, the damage levels can be estimated for new collected
hyperspectral data vectors. It has been noticed that differences in the
spectral characteristics between normal or healthy crops and others
suffering from physiological stress or disease, can be revealed and/or
magnified by simply normalising the data properly. Such effects can be
achieved when normalising each hyperspectral reflectance data vector into a
zero-mean and unit variance vector (i.e., a whitened data vector is
obtained), and then performing a band-wise normalisation on the previous
results (i.e., putting all elements at a certain wavelength interval or
band in one vector and whitening it). Using these normalised vectors in
FVBA gives better results. Also, it has been noticed that using normalised
hyperspectral data, including the training data, gives good results when a
simple nearest neighbour classifier is used to classify our data against
the training data. The correlation coefficient and the sum of squared
differences are used as distance measures in the nearest neighbour
classifier. High correlation is obtained, between the results (of using
FVBA and the nearest neighbour classifier) and the corresponding field
measurements, confirming the usefulness and efficiency of these methods for
this type of analysis.
- Digital video and colour camera in remote sensing of water
Tommy Lindell
Period: 0001-
Partners: CNR, Milan, Italy
Abstract:
Test of the usefulness of air-borne digital camera and video for mapping
water variables. Lindell has been constructing a holder for the digital
video/camera for small aircraft. Data have been collected from Lakes Erken
and Mälaren, and from coral bottoms in Bisceyne National Park.
Recently, tests of the usefulness of those images have been performed for
the classification of the Swedish coastline.
- Detecting Coral Reef Bleaching from Optical Satellites: a pilot and
demonstration project (CORBOS)
Petra Philipson, Tommy Lindell
Funding: Foundation for Strategic Environmental Research (MISTRA),
RESE programme
Period: 0001-0212
Partners: Swedish Meteorological and Hydrological Institute
(SMHI), Norrköping
Abstract:
Recent dramatic bleaching events on coral reefs have enhanced the need for
global environmental monitoring. The development of remote sensing methods
for monitoring of coral reefs requires investigation of the sensor
limitations, the optical properties of the bottom features and
understanding of the influence of the atmosphere and water column on the
collected remote sensing data. This project have been investigating the
possibilities of using remote sensing technique for coral reef monitoring
and change detection, with focus on detection of coral bleaching using
existing satellite sensors. We have compared an IRS LISS-III image taken
during the 1998 bleaching event in Belize to images taken before the
bleaching event. The sensitivity of different sensors has been investigated
and a simulation has been made to estimate the effect of sub-pixel changes.
A manual interpretation of coral bleaching, based on differences between
the images, was performed and the outcome has been compared to field
observations. The spectral characteristics of the pixels corresponding to
the field observations and the manually interpreted bleaching have been
analysed and compared to pixels from unaffected areas, with positive
results for the detection of bleaching from medium resolution satellites.
Procedures for an automated analysis have been tried to make monitoring
more efficient.
A field study has been performed in Belize in 2002 and together with the
use of SPOT and IKONOS images further improvements have been achieved in
detecting changes on coral bottoms.
- HYSENS -- Hyperspectral remote sensing using a new version of ROSIS
Tommy Lindell, Petra Philipson
Funding: ESA/DLR
Period: 0001-
Partners:
Don Pierson, Dept. of Evolutionary Biology, Limnology, UU; Eugenio Zilioli,
CNR, Milan, Province Environment Protection Agency of Trent (APPA),
Province Ecological Agency of Verone (ECOV) and Regional Environment
Protection Agency, Verone, all in Italy
Abstract:
ROSIS for Algal Mapping in Lacustrine Environment (ROSALMA). Rosalma is
essentially oriented to a double task:
- to correlate basic water quality parameters like chlorophyll, suspended
sediment concentrations and Secchi disc to the hyperspectral data by using
a semi-analytical approach already proved in other geographic conditions
and with other hyperspectral devices;
- to determine the best optical spectral windows for mapping the macrophyte
growth, in order to design a possible operational tool to be used for
environmental emergencies of this kind, especially in mapping its spatial
distribution.
Lindell & Philipson have participated in the work on Lake Garda, Italy
earlier and in the evaluations.
The focus of the last part of this project will be devoted to applications
of the MERIS sensor to water quality monitoring, using the experiences
gained from the CASI and ROSIS sensors.
- Industrial plume detection in multispectral remote sensing data
Petra Philipson, Tommy Lindell
Funding: Foundation for Strategic Environmental Research (MISTRA),
RESE programme
Period: 0001-0212
Partners: Marcus Liljeberg, IVL - Swedish Environmental Research
Institute, Stockholm;
Niklas Strömbeck, Dept. of Evolutionary Biology, Limnology, UU
Abstract:
There are a number of paper and pulp industries located along the East
coast of Sweden. The amount of substances discharged into the coastal sea
water is regulated for each industry, but the size of the area affected by
each outlet is relatively unknown and varies during the year.
The general objective for this project was to investigate if and to what
degree remote sensing data could be used to locate and map the extent of
the industrial plumes. Such an investigation involves the analysis of the
optical properties of plumes in comparison to the properties of natural
water constituents. The atmospheric influence on the remote sensing data
must also be considered for any aquatic application that should result in
general descriptions of the properties and quantitative estimations of the
substances present in the water.
Airborne hyperspectral images and laboratory measurements of water samples
have been used to investigate if there are any spectral properties related
to paper mill discharges that can be useful for identification of the
existence and concentration level of the discharges using present and
future remote sensing data.
Besides correlation studies between remote sensing data and field data, the
spectral properties of the discharge water have been investigated and used
in the analysis of available remote sensing data.
- Remote sensing for change detection and monitoring of Case II and lake waters
Petra Philipson, Tommy Lindell
Funding: Foundation for Strategic Environmental Research (MISTRA),
RESE programme
Period: 9701-0212
Partners: Swedish Meteorological and Hydrological Institute (SMHI),
Norrköping
Abstract:
The ability to map and monitor water quality parameters in Case II and lake
waters is of great environmental interest. Images from spectrographic
sensors constitute an important part of such a mapping and monitoring
system. The Compact Airborne Spectrographic Imager (CASI) was used to
collect images over the archipelago of Stockholm, Lake Mälaren and Lake
Erken in August 1997. These images have been evaluated in combination with
simultaneously collected field data. The work in the archipelago has been
concentrated on finding relations between the water quality variables and
the reflectance measurements from the field and correlation analysis
between field and scanned data (CASI). It is unlikely, though, that the
resulting algorithms from these kind of empirical relationships will be
sufficiently general to be used in a variety of contexts. In recent years,
the focus of lake water monitoring by remote sensing, has shifted towards
coupling remotely sensed data to semi-analytical modelling. A simple
bio-optical model for the water environment in lakes has been developed.
The model is mainly based on oceanographic relationships from the
literature. A large historical data set of water quality measurements have
been used together with the model to develop algorithms for the retrieval
of water quality parameters. The model takes as inputs the concentration of
chlorophyll, the concentration of suspended particulate inorganic material
(SPIM) and the absorption of coloured dissolved organic matter (CDOM) at
420 nm. The output from the model is a reflectance spectrum
just above the water surface. From the modelled reflectance, algorithms are
derived for chlorophyll, SPIM and CDOM absorption at 420 nm.
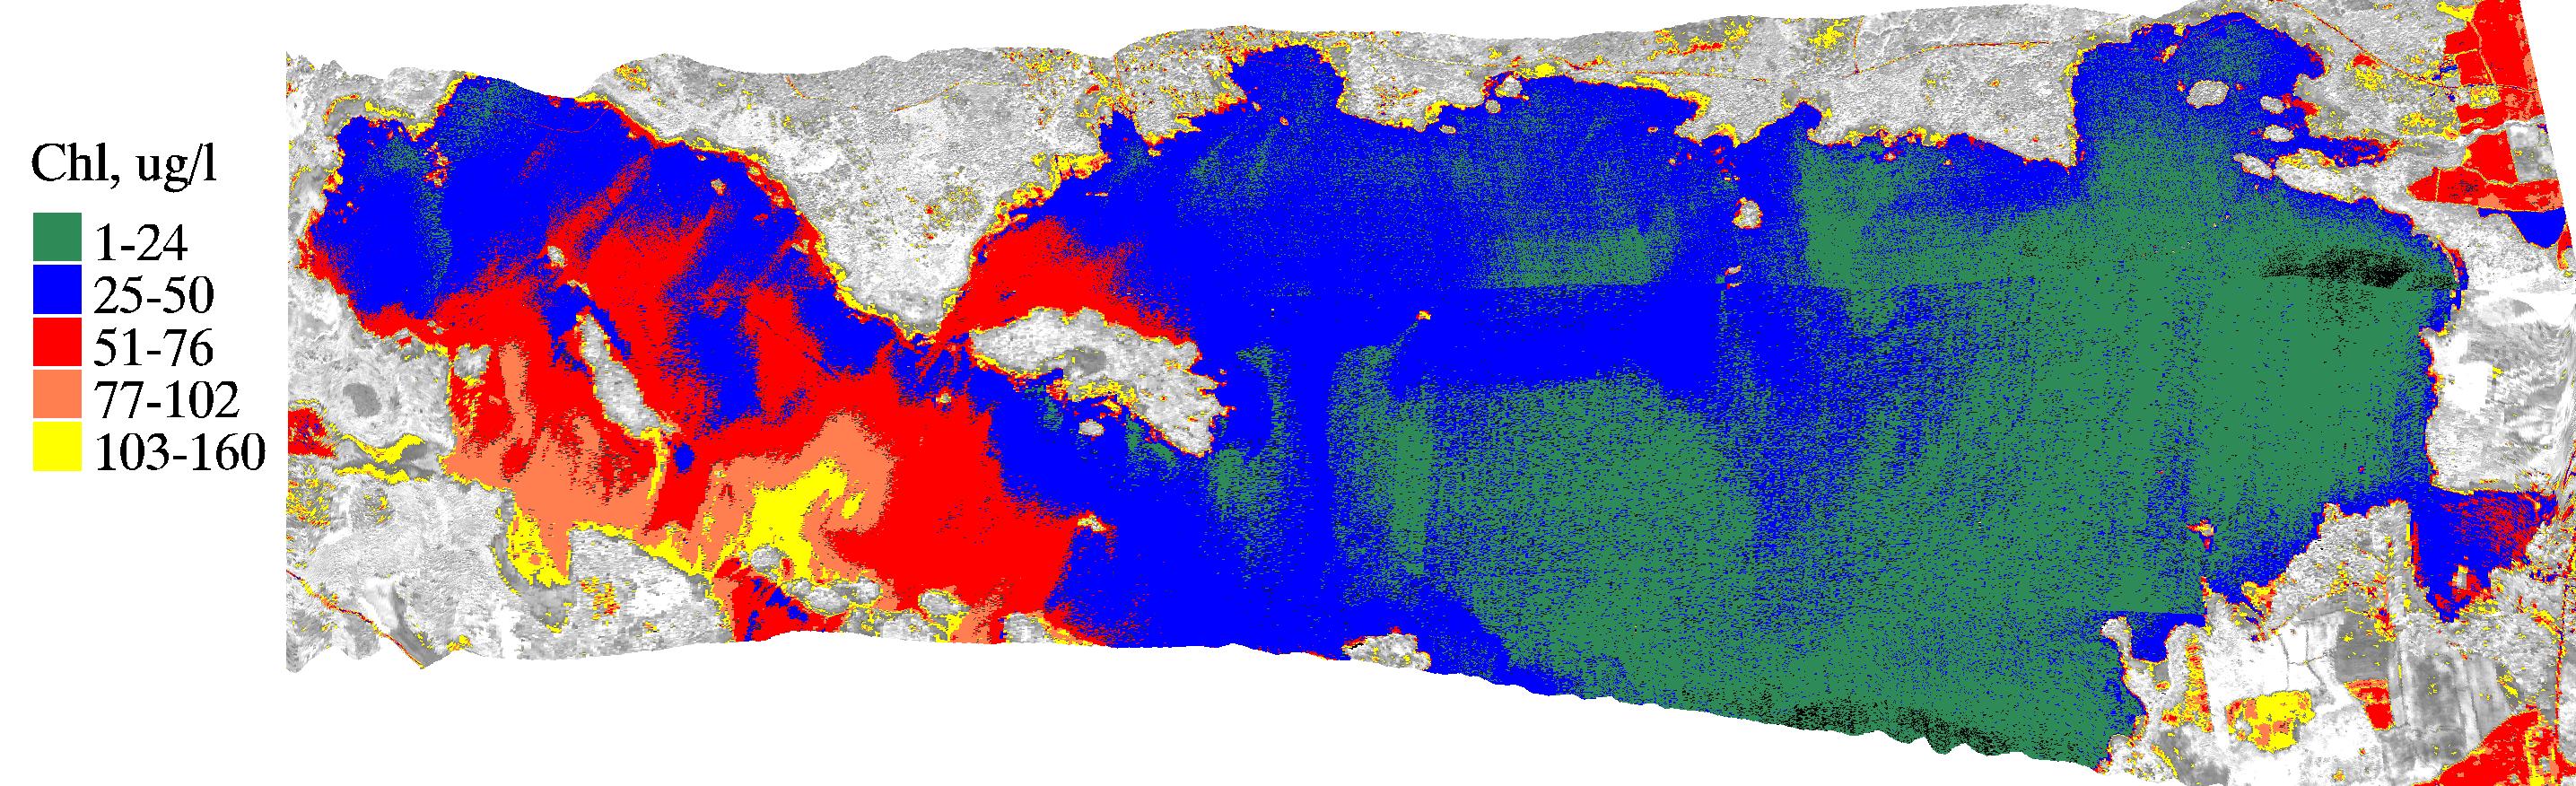
The algorithms were applied to the atmospherically corrected CASI data from
Lake Mälaren and Lake Erken, see Figure 9. The resulting
concentration maps were validated using ground truth measurements. The
results from the validation of the CASI algorithms are satisfying, and the
modelled concentrations and absorption coefficients corresponds well to the
ground truth measurements, which is very encouraging for the future work.
The work has been presented in reviewed international publications.
Figure 9:
Chlorophyll concentrations in Lake Erken on the 6th of August, 1997. The
estimation is made by applying algorithms derived from the bio-optical
modelling to airborne remote sensing data.
- Acquisition of hyperspectral data under the ocean surface
Julia Åhlén, Tommy Lindell, Ewert Bengtsson
Funding: Dept. of Mathematics, Natural Sciences, and Computing,
University College of Gävle; The KK-foundation
Period: 0102-
Abstract:
The examination of image processing techniques for dealing with image
enhancement in underwater conditions is important for scientists involved
with marine environments. One application could be a study of
archaeological sites in various oceans of the world. Generally, historical
objects found under the water have to be analysed directly with
photography. Another application is a different approach to study problems
observed on corals such as bleaching. Prominent blue colour of clear ocean
water, apart from sky reflection, is due to selective absorption by water
molecules. Due to this nature of underwater optics, red light diminishes
when the depth increases, thus producing blue to grey like images. In fact
all red light is gone when reaching 3 m of depth. So far very
few studies have been done on multi- or hyperspectral data taken under the
water. Such studies could develop techniques to efficiently reduce the
negative effects of scatter and light absorption. These effects often
result in bluish images. In this project we are investigating how multi- or
hyperspectral data can be utilised to give us better colour information in
underwater images. Initially we are looking at what techniques are
available for creating an image acquisition system that could give multi-
or hyperspectral data. Approaching the issues of enhancement for underwater
images from the perspective of colour constancy is one of the approaches
that are being investigated. In a cooperation with the University of
Southern Florida, St. Petersburg a field session was performed in the
spring of 2002 in the Mexican Gulf.
- New techniques for information extraction from remotely sensed hyperspectral images
Hamed Hamid Muhammed, Tommy Lindell, Ewert Bengtsson
Funding: UU TN-faculty, Swedish National Space Board
Period: 0001-
Abstract:
A substance can be characterised and recognised by its spectral signature.
The benefit of hyperspectral imagery is that a sufficient number of narrow
spectral bands is available to be able to accurately determine the spectral
response at each pixel in the image. A pixel (or a point spectrum) in a
hyperspectral image can be considered as a mixture of the reflectance
spectra of several substances that can be found in the (remotely sensed)
imaged region. The mixture coefficients correspond to the (relative)
amounts of these substances in the studied region. Linear transformation
methods can be used to project the hyperspectral data on the basis vectors
found by the used transformation. Independent Component Analysis (ICA) and
Principal Component Analysis (PCA) have been used to transform the
hyperspectral data as a first step to get a new set of data that is more
suited for further processing than the original data. The next step is to
interpret and use the ICA or PCA results efficiently. This can be achieved
by using a new technique called Feature-Vector Based Analysis (FVBA) which
has been developed during 2001. The outputs of the transformation step
(which are a number of basis vectors and projections of the original data
on these vectors) are considered as so called Component-FeatureVector pairs
in the subsequent FVBA step. The FVBA task itself is application dependent.
But, the common idea of FVBA is to look at the Feature Vectors to
understand the corresponding Components. FVBA can be used for four main
types of applications. Two of them can directly be distinguished where
either well-defined Feature Vectors or well-defined Components are
obtained. The other two types of applications are feature extraction and
classification. When studying hyperspectral images, the obtained Feature
Vectors and the corresponding Components represent the spectral signatures
and the corresponding weight coefficients images (the relative
concentration maps) of the different constituting substances. During 2001,
the work has resulted in two publication at reviewed conferences, one
describes FVBA itself, and another one about using FVBA for analysing
hyperspectral images.
Next: Research projects No:23-33
Up: Research
Previous: Research projects No:1-11