Fusion of brain images
One part of the project was focused on analysis of PET, SPECT, MR, and CT
brain images. We developed voxel-based registration methods, both for rigid
registration of data from different examinations of the same patient and
for non-rigid registration of data from different individuals.
The rigid registration methods can be used to fuse information acquired
from different imaging modalities to improve medical diagnosis. One example
is from patients suffering from epilepsy where an examination may contain
both SPECT and MR scans and a fusion of the two scans enables accurate
determination of the location of the epileptic foci.
Another important part throughout the fusion project has been a
computerised brain atlas, which maps the human brain into anatomical and
functional regions. Improved methods for atlas-based analysis and more
accurate image registration methods have been developed. The brain atlas
technique was used in a project aiming to quantify the effects from carotid
endarterectomy on patients suffering from carotid artery stenosis. Selected
vascular brain atlas regions were used to measure the differences between
preoperative and postoperative SPECT scans. Finally, the measured
differences were correlated to other observed variables describing the
outcome of the operation. Previously, the brain atlas was used for
discrimination from SPECT scans between patients suffering from Alzheimer's
disease and normal controls subjects.
Another development result has been improved methods for combined
3D visualisation of volume images. The new methods enables visualisation of
information from different imaging modalities together in the same rendered
image. Furthermore, methods has been developed to incorporate atlas
structures into the 3D visualisation, which enables more accurate
localisation of different features in the image data.
In November 2001, this work was presented and defended as a PhD thesis by
Lundqvist. During 2002, he has worked on making the implementation of the
methods in the atlas more robust and user friendly, on clinical
verification of the methods and on finalising some publications documenting
the results.
Arteries-veins separation in magnetic resonance angiography images
Another part of the project aimed at selecting a subset of volumetric data,
and to present it in such a way as to make diagnosis easier. As an example,
in magnetic resonance angiography (MRA), it is of great interest to be able
to separate arteries from veins. This problem is not trivial, because the
vessels can lie in close parallel throughout the image. Our algorithm
extends the concept of binary connectedness by using a grey-level
connectedness approach using fuzzy sets. As a start set we used small sets
of voxels marked by the user. Good user interaction possibilities,
portability and reusability were important concerns in this project. That
is why we chose to use public domain packages: the Visualization Toolkit
(VTK) and the Insight Segmentation Toolkit. The work was published in
``Journal of Magnetic Resonance Imaging'' during this year.

|
Figure 3: Left: A manually segmented slice of the right hippocamopus. Middle: A segmented slice of the hippocampus using the original automatic segmentation method. Right: A segmented slice of the hippocampus using the improved automatic segmentation method.
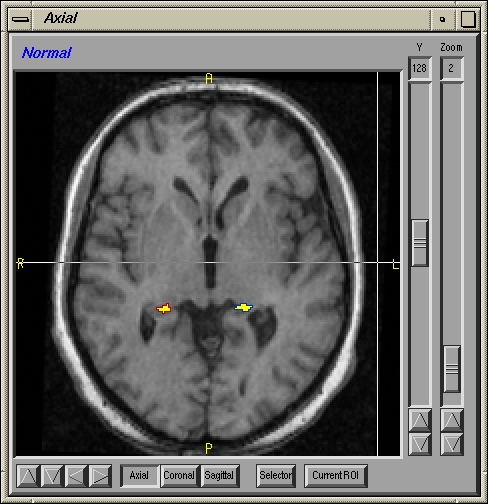
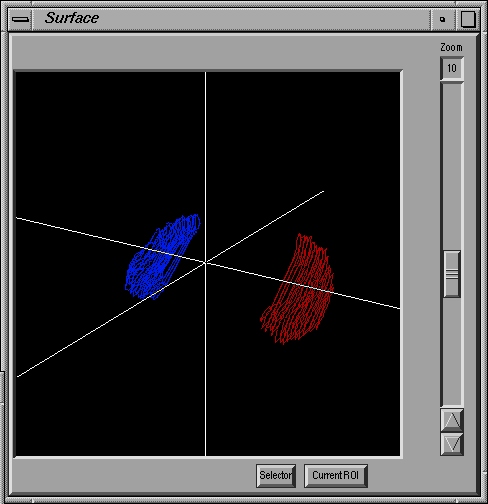
Figure 4: Left: A slice showing the two hippocampi segmented. Right: A 3D view of the two hippocampi.
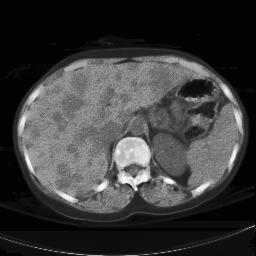
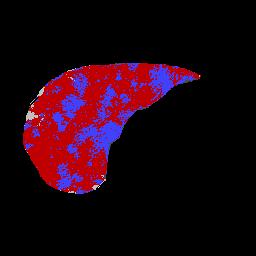
Figure 5: Left: Liver metastasis as seen on a CT scan slice of a patient. Right: A primary segmentation result using the mean-shift algorithm.
Segmentation of cytoplasms
The cell nucleus has a well-defined shape and is relatively easy to detect.
The cytoplasm is however more complex. The first goal of this project was
to develop a fully automatic method for cytoplasm segmentation. The present
algorithm, inspired by literature and previous experience, consists of an
image pre-processing step, a general segmentation and merging step followed
by a quality measure and a splitting step. By training the algorithm on one
image, it is made fully automatic for subsequent images created under
similar conditions. This method was presented at an internal Amersham
Pharmacia Biotech R&D conference in Uppsala in late 1999. During 2000 the
algorithms were improved through a more elaborated shape analysis and a
more consistent feature extraction and quality evaluation step. The results
were presented at an international conference in 2001 and documented in a
journal paper that was published in 2002.
Classification of Rac1 activation
Based on the experience from the segmentation of cytoplasms, a more problem
specific project was initiated in cooperation with Amersham Biosciences in
Cardiff, UK, in 2002. The aim of this project was to develop algorithms
enabling fully automatic, real-time segmentation and analysis of
fluorescence images of cells so as to quantitatively estimate the IGF-1
induced translocation of GFP-Rac1 to the cellular membrane for individual
cells. See Figure 6. Due to the ultimate goal of analysing
one image containing roughly 200 cells in less than two seconds, effort was
taken not to use algorithms of high time complexity. The results were
documented in a journal paper to be submitted for publication.
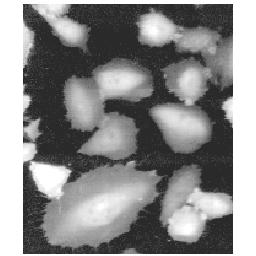
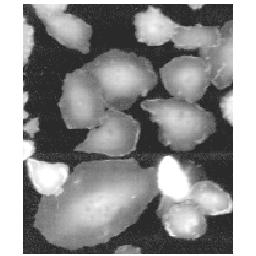
Figure 6: CHO-hIR cells expressing GFP-Rac1 fusion protein, imaged on IN Cell Analyzer, Amersham Biosciences, Cardiff, UK. Cytoplasms, before (left) and 4.3 min after (right) incubation with IGF-1. The translocation of GFP-Rac1 appears as bright formations along the edges of the cells. This translocation can be quantified by image analysis.
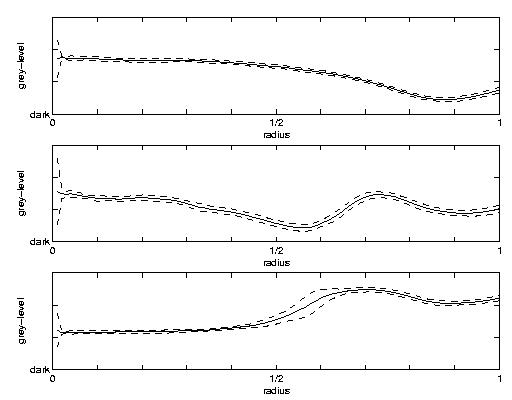
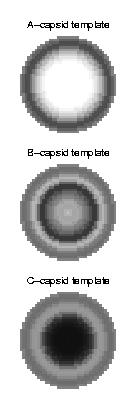
Figure 7: Left: Class grey-level profiles and standard deviation for the three classes of capsid maturation. The radius is ranging from 0, being the centre, to 1 being the edge of the capsid shelf. The solid lines correspond to the grey-levels at each radius and the dashed lines to the grey-level +/- 2 standard deviations. Right: Templates of radius 20 constructed from the class grey-level profiles.