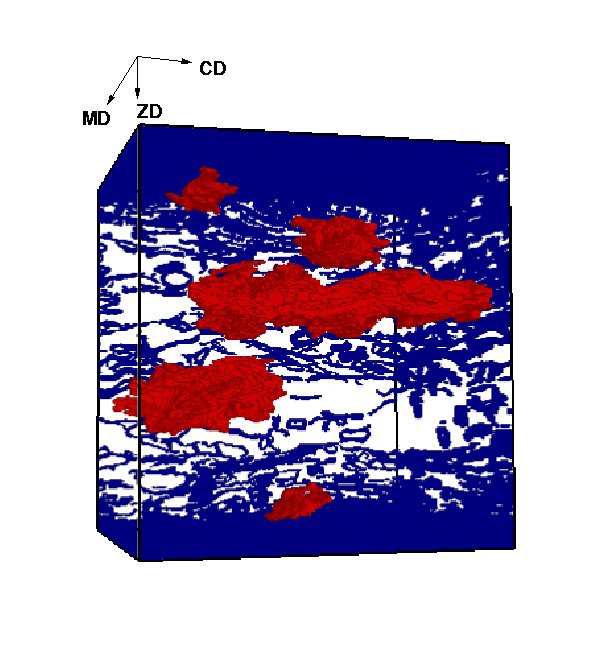
In this project, both segmentation algorithms for individual fibres and for the porous structure are investigated, see Figure 2 for individually segmented pores. The project objective is to achieve a fully segmented paper volume where any measurement of the internal structure is available, creating relations between microscopical and macroscopical properties of paper. These methods can also be used for other fibrous and porous materials.
In the project a volume image of paper, created from a series of 2D scanning electron microscopy (SEM) images at StoraEnso in Falun, is available for the studies. Other volume images are also used and new methods for creating other sample volume images are investigated.

|
|
In earliest phase of the project, a technique for studying the pattern of noise distributions and correlation in both synthetically and experimentally generated PET images, using autocor relation function (ACF) was developed. The results were illustrated as one-dimensional (1D) profiles and even visualized as two-dimensional (2D) ACF images, revealing information about the noise properties which was then further explored. Experimental PET data were acquired in 2D and 3D acquisition mode and reconstructed by both analytical filtered back-projection (FBP) and iterative ordered subsets expectation maximization (OSEM) methods. Also, the results from these studies were compared with results from covariance matrix. Furthermore ACF has been applied on other medical imaging modalities such as Single Photon Emission Computed Tomography (SPECT), Computed Tomography (CT) and PET-CT for investigation of noise properties in these imaging tools.
Average images have been used to reduce the noise in PET images, but these average images tend to dampen the differences between regions of different kinetics. Parametric images, aiming at extracting areas with specific kinetic properties can enhance the discrimination between regions and normal contra pathology, but such methods typically enhance noise or at least do not optimize signal-to-noise ratio. It is clear that in several types of PET studies, the existing methods for generating diagnostic images, using either summations or parametric images, are not optimal. Therefore, Principal component analysis (PCA) and Independent Component Analysis (ICA) have been studied on dynamic PET images to study if it is possible to generate images, which emphasized regions withdifferences in behavior.
Different types of normalization algorithms have been suggested and studied for better optimization of signal-to-noise ratio in PET images before applying PCA and ICA. These studies have even been followed by studies concerning application of these two multivariate methods on normalized PET images, utilizing time-activity data obtained by using a reference region. The methods are adopted for certain PET applications, notably for the diagnosis of Alzheimers disease with a new amyloid binding PET tracer. The methods are probed and fine tuned both on synthetic and clinical PET images with the purpose to optimize the signal to noise ratio in these images.
![\includegraphics[width=0.27\textwidth]{Images/Xa.ps}](img24.png)
![\includegraphics[width=0.27\textwidth]{Images/Xb.ps}](img25.png)
![\includegraphics[width=0.27\textwidth]{Images/Xc.ps}](img26.png)