Scientific Visualization
In principal, all research needs to some extent visualization, where the goal is to produce an insightful graphical display of data.
Visualization technology is used to transform large, complex datasets into a visual form that enhances human interpretation of the data.
Visualization is either used as a general analysis tool throughout the process or as a tool to present the results.
Scientific visualization is still a comparably young research topic and a common definition has not yet crystalized. In fact, it seems that everyone who visualizes has his/her own definition.
Computer graphics and visualization is an active field with many applications on the Internet, movie, and computer game markets. Another application is medical image analysis.
Images constitute the basic data to visualize in many cases. Hence, algorithms for computer-supported image analysis dramatically increase the possibilities to extract essential information from large sets of images and to identify crucial image properties not easily discernable to the human eye.
We perform research where the data are large three- or four-dimensional digital images from medical areas. Despite the large data sets, the information relevant to the diagnostic physician is usually rather limited. The purpose of imaging is to output qualitative and quantitative information about the object(s) of interest. An object refers to, e.g., a brain, a liver, or a blood vessel. For further information on our projects, see links below.
|
|
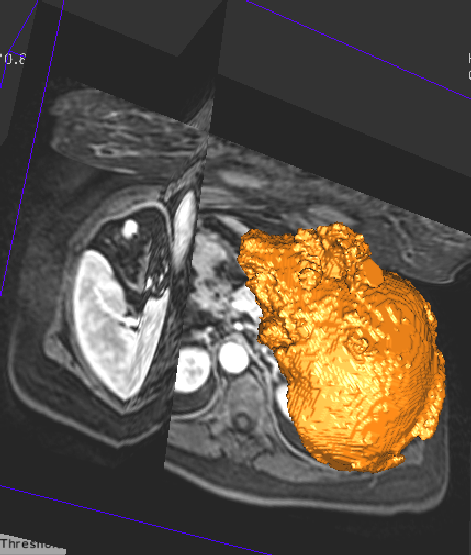
Visualization of the liver, segmented from a 3D magnetic resonance image.
|
Research projects