|
9. Analysis of skeletal muscle fibers in three dimensional images
Patrick Karlsson, Ewert Bengtsson, Joakim Lindblad
Partners: Anna-Stina Höglund, Alexander Cristea, Jingxia Liu, Lars Larsson, Dept. of Neuroscience, UU Hospital
Funding: VR, The Swedish Research Council
Period: 0603-080930
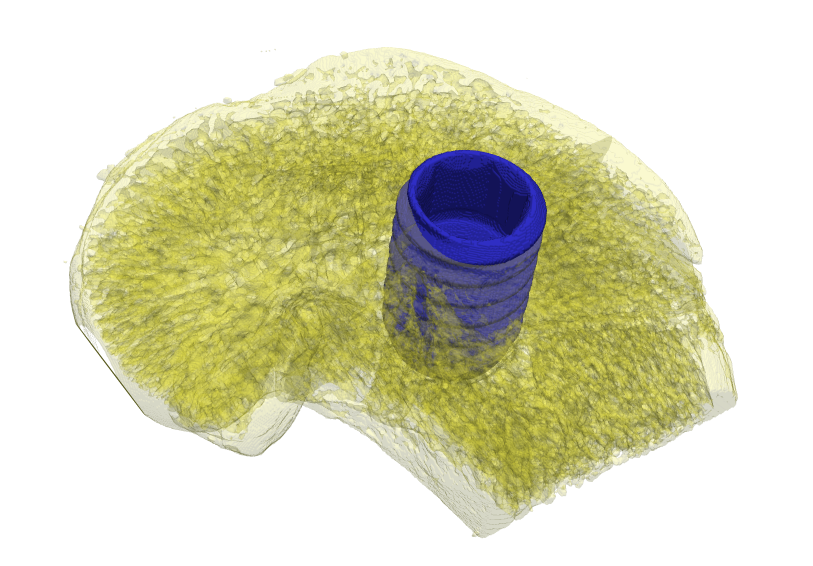
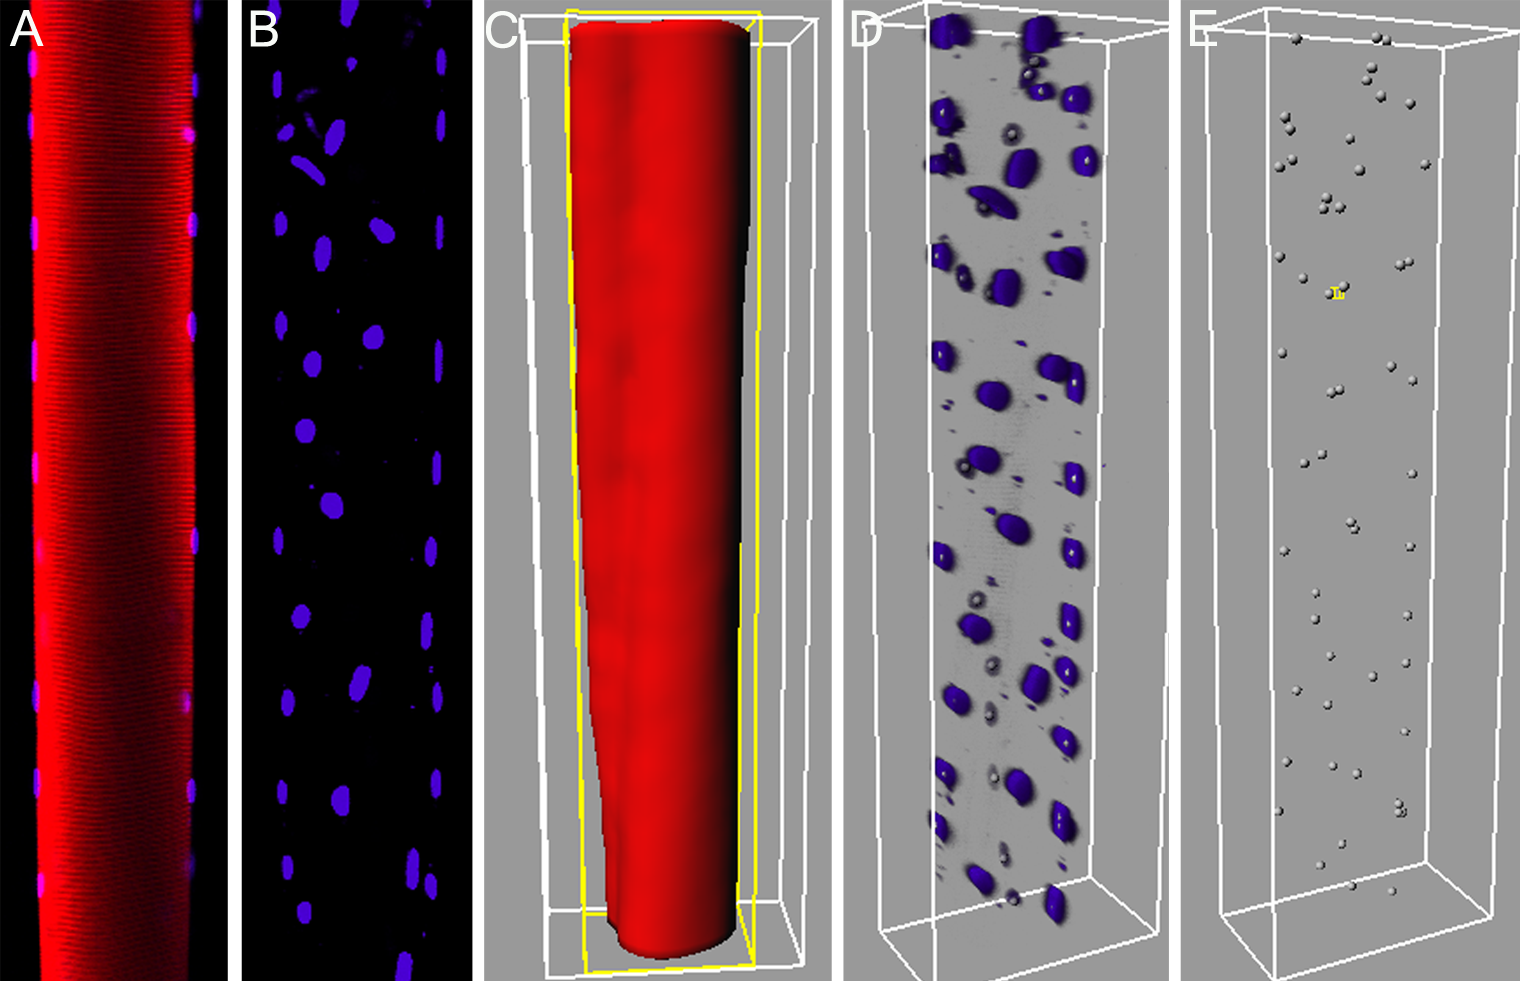
Abstract: A highly detailed 3D spatial description of the organization of myonuclei in healthy and diseased human skeletal muscle cells enables detailed understanding of the underlying mechanisms of muscle wasting associated with, e.g., neuromuscular disorders, and aging. In this interdisciplinary collaboration between the Center for Image Analysis (CBA) and the Muscle Research Group (MRG), both at Uppsala University, we have developed and evaluated new methods for modeling and quantitative analysis of the 3D distributions of myonuclei. The project has been based on the proficiency of modern confocal microscopic techniques to create true 3D volume images. Advanced computerized modeling of the elongated generalized cylinder structure of the imaged muscle cells has been developed and used for the investigation of the myonuclear domains, i.e., each finite volume in which a myonucleus control the gene products. The complex topological conditions put on 3D models and measurement methods, compared to 2D equivalents, has been a challenge in developing appropriate image analysis tools and algorithms. The project involved comparison of muscle fibers between different species, and comparison of human muscle fibers with relation to a patient's age, and the muscle genotype. The project was presented orally in 2008 at the International Symposium on Biomedical Imaging, Paris, France, and thoroughly presented in two Ph.D. theses at Uppsala University on the same day, September 19, by Alexander Cristea and Patrick Karlsson respectively. Also a journal article was accepted for publication in 2009. There is a substantial potential of using and further developing the methods created within the project and we are currently seeking ways of funding such continued collaborative work between the two groups. See Fig. 5.
|
10. Analysis of rat embryo heart activity
Khalid Niazi, Ewert Bengtsson
Partners: Mats Nilsson, Bengt Danielsson, Div. of Toxicology, Dept. of Pharmaceutical Biosciences, UU
Funding: COMSATS IIT, Islamabad, Pakistan
Period: 0702-
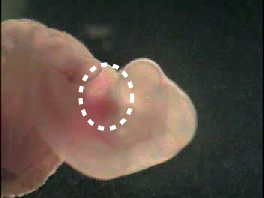
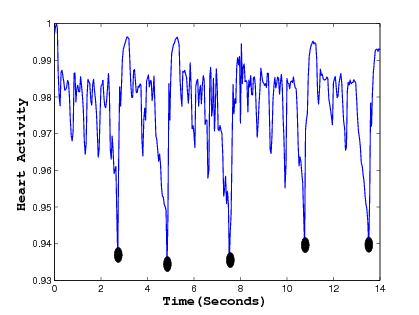
Abstract: Empirical mode decomposition (EMD) is a powerful data analysis technique which decomposes any complicated signal into intrinsic mode functions (IMF). EMD is usually combined with Hilbert transform to analyze the instantaneous frequency in non-stationary signals. This combination is commonly referred as Hilbert-Huang Transform (HHT). In this project, we have used EMD with slight modification to detect periodic activity in rat embryo's heart. The normal embryo's heart activity can easily be detected by local maxima detection but it becomes a challenging task once the heart activity becomes abnormal. For instance, Fig. 6 shows a rat embryo on the left while an abnormal heart activity is shown on the right as a function of time.
EMD decomposes the signal into different IMF functions; where each IMF function is believe to capture different frequency range. It is different from Fourier transform and Wavelet transform in the sense that it has got adaptive basis. Fourier transform relies on Cosine basis and requires a number of cutoffs if one needs to decompose a signal using a Fourier transform. Wavelet transform requires the selection of mother wavelet, and also the level of decompositions which is one of the most difficult tasks if one wants to automate a process. On the other hand, EMD generates the IMF functions from the underlying signal making it adaptive in nature. We have exploited this property to denoise the complicated signal which has resulted in easy detection of maxima during abnormal heart activity.
|
11. Automated localisation of macromolecules in cryo electron tomographic data
Stina Svensson, Magnus Gedda
Partners: Dept. of Cell and Molecular Biology (CMB), Karolinska Institute, Stockholm
Funding: The Swedish Research Council; S-faculty, SLU; TN-faculty, UU
Period: 0401-
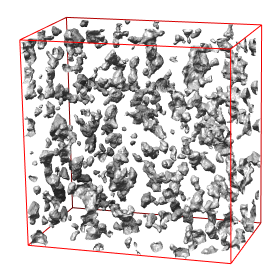
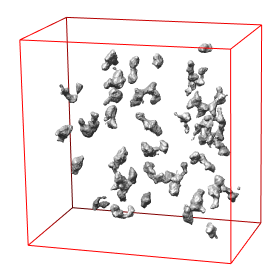
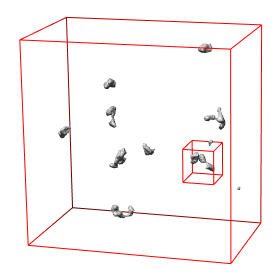
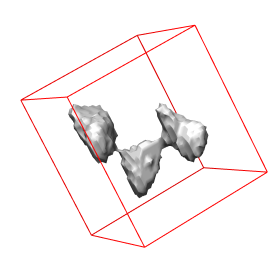
Abstract: State of the art imaging techniques make it possible to study individual proteins and other macromolecules from a structural point of view. Descriptions with respect to geometry and shape facilitates studying protein dynamics. This type of study is essential to increase the understanding of their biological role. CMB has developed methods, using cryo electron tomography (Cryo-ET), for 3D imaging of individual proteins at a resolution of a few nm. Localisation of the protein in the image has so far been done manually. For large-scale studies, computerized image analysis serves as an essential tool to automatically and objectively analyse image content. In this project, we develop methods to automatically localise macromolecules from in vitro Cryo-ET images and thereby make large-scale studies of proteins possible. This is done by taking into account both grey-level information (which reflects the internal structure of the protein) and 3D shape information. See Fig. 7.
The first step in the process is to identify positions in the Cryo-ET image likely to hold a protein of the searched protein type. The second step is to further investigate the structure in each such position with respect to the outer shape of the structure itself and of its subunits and thereafter take a decision on whether it belongs to the protein type or not. This step is tailored for each protein type. During 2008 we have built systems to localise proteins which consist of a set of roundish subunits of equal size and to localise proteins which consist of one elongated and one roundish subunit.
(a)
(b)
|
(c)
(b)
|
12. Segmentation and analysis of point-like fluorescent signals in 2D and 3D images of cells
Amalka Pinidiyaarachchi, Amin Allalou, Carolina Wählby
Partners: Malin Jarvius, Chatarina Larsson, Katerina Pardali, Ola Söderberg, Irene Weibrecht, Mats Nilsson, Agata Zieba, Dept. of Genetics and Pathology, UU
Funding: EU-Strep Project ENLIGHT; SIDA
Period: 0305-
Abstract: The interior of a cell is elaborately subdivided into many functionally distinct compartments, often organized into intricate systems. One way of studying such compartments is by the use of different fluorescent markers that bind specifically to the objects of interest, in this case padlock- and proximity probes. This type of staining followed by imaging through a fluorescence microscope results in point-source signals, together with compartment-specific stains, background noise and autofluorescence. 3D images are acquired by making non-invasive serial optical sections of the object. Analysis of spatial relationships in 2D and 3D requires pre-processing followed by signal detection and segmentation of cell compartments combining intensity and shape information. Once the signals are detected, the goal is to analyze spatial relationships and non-random patterns in the signal distribution.
13. Image based measurements of single cell mtDNA mutation load
Amin Allalou, Carolina Wählby
Partners: Anton K. Raap, Frans M. van de Rijke, Roos Jahangir Tafrechi, Dept. of Molecular Cell Biology, Leiden University Medical Center, The Netherlands; Visiopharm, Hørsholm, Denmark
Funding: EU-Strep Project ENLIGHT
Period: 0608-
Abstract:
Cell cultures as well as cells in tissue always display a certain degree of variability, and measurements based on cell averages will miss important information contained in a heterogeneous population. An automated method for image based measurements of mitochondiral DNA (mtDNA) mutations in individual cells has been implemented and integrated as a part of the VIS image analysis platform. The methods are used on a daily bases in the continued work on mutation load analysis at Leiden University Medical Center in the Netherlands. The development of image based single cell analysis will continue to be in focus in the ongoing ENLIGHT project.
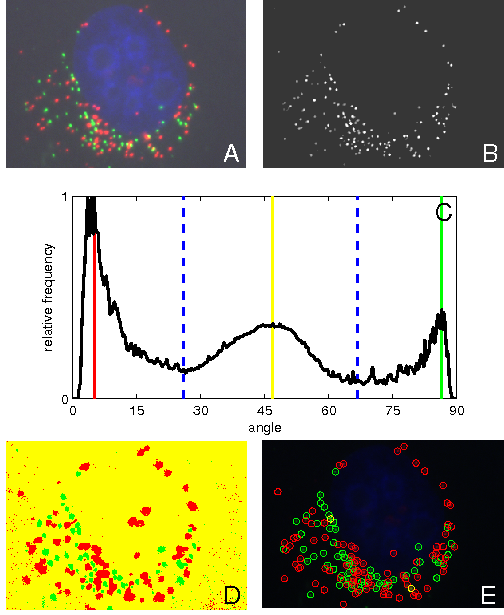
14. Quantification and localization of colocalization
Milan Gavrilovic, Carolina Wählby
Funding: EU-Strep Project ENLIGHT
Period: 0611-
Abstract: In fluorescence microscopy, during image acquisition of multiply labeled specimen, two or more of the emission signals can often be physically located in the same area or very near to one another in the final image due to their close proximity within the microscopic structure. This is known as colocalization. Colocalization is particularly important for revealing information on how and where bio-molecules such as proteins and protein complexes interact within a cell, as well as in which sub-cellular structures they are present. If red and green fluorochromes are selected colocalization will appear as yellow emission. Existing methods for quantification and localization of colocalized pixels have been implemented and compared. At the same time new methods for detection of cross-talk and colocalization based on spectral decomposition have been developed. We show that robustness of detection of colocalization can be improved by separating color information from intensity information. Color can then be represented using an angle histogram, created by compensating for discretization noise. Standard methods for histogram-based classification are thereafter applied to detect red, green, and colocalized pixels. See Fig. 8.
|
17. Parallax error correction in retinal image registration
Khalid Niazi, Ewert Bengtsson, Ingela Nyström
Partner: Albert Alm, Dept. of Neuroscience, UU Hospital
Funding: COMSATS IIT, Islamabad
Period: 0711-
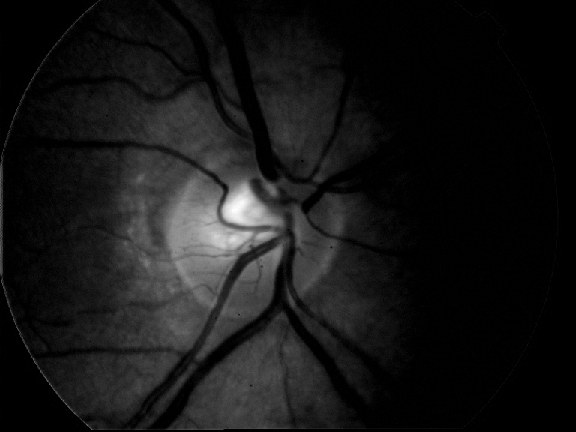
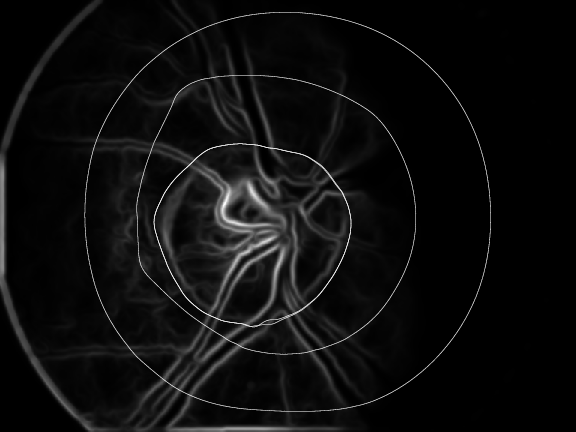
Abstract: Retinal imaging is one of the main sources in ophthalmology to study the optical nerve head and the retina. Retinal images are often used for analyzing, diagnosing and treating a number of diseases of the human retina. Image registration plays an important role in determining the progression of retinal illness. In the current project, we are developing a method which will help in evaluation of glaucoma progression. We are especially concentrating on correction of parallax error, which is normally produced due to a change in the angular position of the camera. Our goal is to automatically find the points where the vascular structure intersects the optical disc, and subsequently use these points for registration purposes.
Retinal images are normally suffering from noise. For instance, Fig. 9a) shows a typical retinal image which is suffering from noise and low contrast. We have used bilateral filtering for noise removal. Bilateral filtering is well known to reduce noise while preserving the edges at the very same time. This process is followed by edge detection which is performed using first order absolute moment (FOAM). FOAM is good at edge detection and localization but is very sensitive to noise. Preprocessing by bilateral filtering makes FOAM an ideal candidate for edge detection. In order to detect the optical disc boundary, a snake is initialized at the image border, where the edge image will serve as potential function for the snake. The introduction of bilateral filtering and FOAM has given us the freedom to initialize the snake quite far away from the optical disc. Fig. 9b) shows the process of optical disc detection from the edge image of Fig. 9a) using snakes. This prior step to identify where the vascular structure intersects the optical disc is under evaluation.
|
|
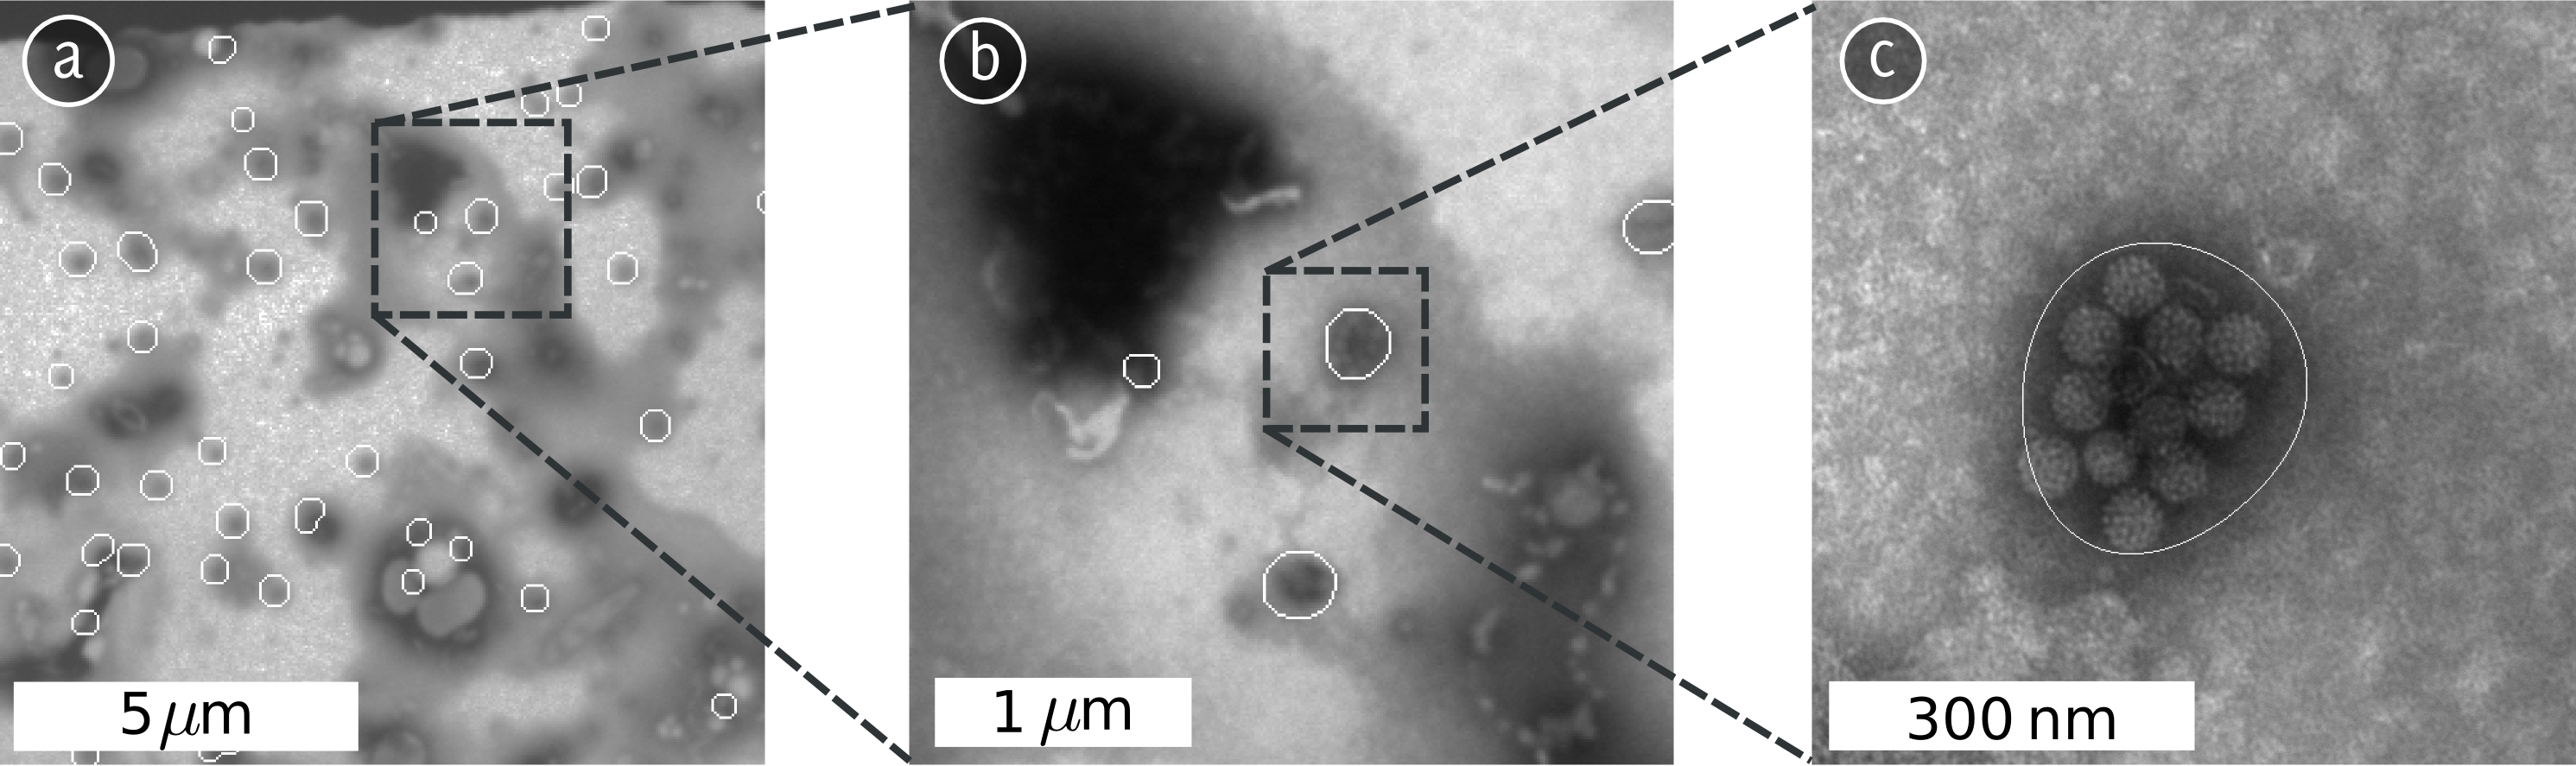
19. Analysis of virus morphology in electron microscopy images
Ida-Maria Sintorn
Partner: Vironova AB
Funding: VINNMER programme, Swedish Agency for Innovative Systems
Period: 0801-
Abstract: Electron Microscopy allows for studying virus morphology at the nm level. This means that structural differences between virus maturation stages, related virus species, wild type virus and virus treated with a potential drug or a small molecule can be analyzed. Both external (shape and protein patterns on the virus surface) and internal structural differences can be analyzed. In this project methods for identifying and quantifying such structural differences are developed.
20. A multidisciplinary approach to establish mechanisms for mitochondrial DNA segregation in human disease
Amin Allalou and Carolina Wählby
Partners: Nils-Göran Larsson, Karolinska Institute; Mats Nilsson, Dept. of Genetics and Pathology, UU
Funding: The Swedish Research Council, Collaboration Grant, Medicine
Period: 080101
Abstract: Mutations of mitochondrial DNA (mtDNA) cause genetic syndromes with widely varying phenotypes and are also implicated in many age-associated diseases and the ageing process itself. Our knowledge of the principles governing segregation of mtDNA mutations in somatic tissues and in the germ line is very limited. In this collaborative project we combine a powerful technique for detection of individual mtDNA molecules with image analysis. We work with a variety of mouse models and the goal is to develop image analysis software to do three-dimensional (3D) reconstruction of the distribution of mutated mtDNA molecules in mammalian tissues. We want to use this technology to study segregation of mtDNA mutations in mouse tissues and to study the mtDNA bottleneck by visualizing the distribution of mutated mtDNA during oogenesis. The ultimate goal is to study the distribution of mtDNA mutations in embryos and placenta to establish principles for prenatal diagnosis.