next up previous contents
Next: Cooperation partners Up: Research Previous: Research   Contents


Current research projects

Theory: discrete geometry, volumes and fuzzy methods
  1. Skeletonization in 3D discrete binary images
    Robin Strand, Ingela Nyström, Gunilla Borgefors
    Funding: UU TN Faculty, Graduate School in Mathematics and Computing (FMB), SLU S Faculty
    Period: 9501-
    Partners: Gabriella Sanniti di Baja, Istituto di Cibernetica, CNR, Pozzuoli, Italy
    Abstract: Skeletonization is a way to reduce dimensionality of digital objects. A skeleton should have the following properties: topologically correct, centred within the object, thin, and fully reversible. In general, the skeleton can not be both thin and fully reversible. We have been working on 3D skeletonization for the last decade.
    By finding the set of centers of maximal balls (CMBs) and keeping these as anchor points in the skeletonization, the reversibility is guaranteed. In 2007, some results for extracting CMBs in a distance transform using weighted distances based on neighbourhood sequences were published and presented at the ISPA conference.

  2. Distance functions and distance transforms in discrete images
    Robin Strand, Gunilla Borgefors, Stina Svensson, Filip Malmberg
    Funding: SLU S Faculty, Graduate School in Mathematics and Computing (FMB)
    Period: 9309-
    Partner: Benedek Nagy, Dept. of Computer Science, Faculty of Informatics, University of Debrecen, Debrecen, Hungary
    Abstract: The distance between any two grid points in a grid is defined by a distance function. In this project, weighted distances have been considered for many years. Recently, a distance function using both weights and neighbourhood sequences was introduced. The neighbourhood sequence allows the size of the neighbourhood to vary along the paths. Optimal weights and neighbourhood sequences, condition for metricity, and algorithms have been derived and presented for the square grid. This distance function has been evaluated by comparing it to the traditional weighted distance and distances based on neighbourhood sequences. In a distance transform (DT), each picture element in an object is labeled with the distance to the closest element in the background. Thus the shape of the object is "structured" in a useful way. Only local operations are used, even if the results are global distances. DTs are very useful tools in many types of image analysis, from simple noise removal to advanced shape recognition. Since the distance defined by using both weights and a neighbourhood sequence is defined by a minimal cost-path using only a neighbourhood, it is computationally efficient -- also for the case with constrained distance. Moreover, since it uses both weights and neighbourhood sequences, the rotational dependency is low.

  3. Comparison of gray weighted distance measures
    Magnus Gedda
    Funding: SLU S Faculty; UU TN Faculty
    Period: 0601-
    Abstract: In several application projects we have discovered the benefit of computing distances weighted by the gray levels traversed, e.g., Project 12. There are many ways of doing this, and in this project we have made a thorough comparison of the distances calculated with Gray Weighted Distance Transforms (GWDT) and the Weighted Distance Transforms On Curved Spaces (WDTOCS). The next step is to do a thorough examination of the performance of the underlying algorithms in these calculations.

  4. Polar distance transform
    Kristin Norell, Joakim Lindblad, Stina Svensson
    Funding: Swedish Timber Measurement Council (VMR), SLU S Faculty
    Period: 0702-
    Partners: Swedish Timber Measurement Council (VMR), Dept. of Forest Products and Markets, SLU
    Abstract: Distances and minumum cost paths between pixels can be measured using distance transforms. In this project we focus on images, where circular paths are preferred over straight lines. By introducing the polar distance transform (PDT) we avoid conversion of the image to polar coordinates and associated resampling problems.
    In the PDT, each pixel is related to an origin in the image, which is an (approximate) centre of a circular pattern or shape. A path is made up from a sum of local steps, taken in a neighbourhood around each pixel. Different weights are used for steps in the radial and angular direction, respectively, and are related by a function, , that can be a function of the radius. By giving a high cost in the radial direction compared to the angular, the shortest path between two points on the same radius is a circle segment on that radius. Different relations between the weights, give different shapes of the distance image. Figure 2 shows that a higher value of gives a more circular shape.
    We also extend the PDT to a grey weighted polar distance transform, where an intensity image is used as a cost function for the PDT.
    A neighbourhood is used in the computation of a local step, both in the PDT and the GWPDT. This reduces the octogonal pattern that would be the case with the neighbourhood. To use the neighbourhood is new to the application of grey weighted distance transforms, and attention must be paid to all pixels that are covered in a step to be sure that the path is really a minumum cost path. Our method for the whole neighbourhood can be used also in other grey weighted distance transforms, not only the GWPDT. The GWPDT is used as a tool for outlining annual rings on log end face images (see Project 27).
    This project resulted in a publication at the 14th International Conference on Image Analysis and Processing (ICIAP 2007).

    Figure 2: Distance images of size $300 \times 300$ pixels with the PDT computed from the pixel marked with an and with the origin in the centre of the images. Dark pixels correspond to low distance values.
    Image DTgamma002 Image DTgamma010

  5. Image processing and analysis of 3D images in the bcc and fcc grids
    Robin Strand, Gunilla Borgefors
    Funding: Graduate School in Mathematics and Computing (FMB)
    Period: 0308-
    Partners: Christer Kiselman, Dept. of Mathematics, UU; Peer Stelldinger, University of Hamburg, Germany; Benedek Nagy, Dept. of Computer Science, Faculty of Informatics, University of Debrecen, Debrecen, Hungary
    Abstract: The main goal of the project is to develop image analysis and processing methods for volume images digitized in non-standard 3D grids. Volume images are usually captured in one of two ways: either the object is sliced (mechanically or optically) and the slices put together into a volume or the image is computed from raw data, e.g., X-ray or magnetic tomography. In both cases, voxels are usually box-shaped, as the within slice resolution is higher than the between slice distance.
    Before applying image analysis algorithms, the images are usually interpolated into the cubic grid. However, the cubic grid might not be the best choice. In two dimensions, it has been demonstrated in many ways that the hexagonal grid is theoretically better than the square grid. The body-centered cubic (bcc) grid and the face-centered cubic (fcc) grid are the generalizations to 3D of the hexagonal grid. In the bcc grid, the voxels consist of truncated octahedra, and in the fcc grid, the voxels consist of rhombic dodecahedra. The fcc grid is a densest packing, meaning that the grid points are positioned in an optimally dense arrangement. The fcc and bcc grids are reciprocal, so the Fourier transform on an fcc grid results in a bcc grid. In some situations, the densest packing (fcc grid) is prefered in the frequency domain, resulting in a bcc grid in spatial domain. In some cases, the densest packing is prefered in the spatial domain. Some results about a visualization algorithm with the fcc and bcc grids were presented at ICIAP, see Section 14. By using a smooth object and a grid that is dense enough, it is shown that the surface of the object using the proposed visualization algorithm has the same topology as the original object.
    The basic theory for weighted distance based on neighbourhood sequences (see Project 2) has been derived for the fcc and bcc grids resulting in a number of publications. A functional form of the distance between two grid points were presented at the DGCI conference. Manuscripts in which parameters minimizing the rotational dependecy and conditions for metricity are presented have been accepted for publication. In Figure 3, the asymptotic shapes of balls using optimal weights and neighbourhood sequences are shown for the fcc and bcc grids, respectively.

    Figure 3: The asymptotic shape of balls when the optimal (the compactness ratio is minimized) weights and neighbourhood sequences are used for fcc (left) and bcc (right). Transparent Euclidean balls are shown for illustration.
    Image fcc_ill Image bcc_ill

  6. Fuzzy shape analysis in 2D and 3D
    Joakim Lindblad, Ingela Nyström, Gunilla Borgefors
    Funding: SLU S Faculty, UU TN Faculty
    Period: 0109-
    Partners: Nataša Sladoje (Matic), Faculty of Engineering, University of Novi Sad, Serbia
    Abstract: The advantages of representing objects in images as fuzzy spatial sets are numerous and have lead to increased interest for fuzzy approaches in image analysis. Fuzziness is an intrinsic property of images and a natural outcome of most imaging devices. Preservation of fuzziness implies preservation of important information about objects and images. Our previous results within this project show that an improved precision of shape description can be achieved if the description is based on a fuzzy, instead of a crisp shape representation, where the fuzzy membership of a point reflects the level to which that point belongs to the object.
  7. Defuzzification of fuzzy segmented objects by feature invariance
    Joakim Lindblad, Ingela Nyström, Stina Svensson
    Funding: SLU S Faculty, UU TN Faculty
    Period: 0301-
    Partners: Nataša Sladoje (Matic), Tibor Lukic, Faculty of Engineering, University of Novi Sad, Serbia
    Abstract: This project concerns the development of a method for feature based defuzzification of spatial fuzzy sets. The developed method Defuzzification by Feature Distance Minimization generates crisp shapes from fuzzy shapes by finding a crisp shape at a minimal distance to the fuzzy shape. We define the distance between two fuzzy sets as a distance between their feature-based representations in a chosen feature space. We have found it appropriate for defuzzification to incorporate both local and global features of the two sets. We have studied the use of membership values, gradient, area, perimeter, and centre of gravity in the distance measure. Several existing distance measures can be used to define the distance measure in the feature space. We have so far focused the research on Minkowski type distances measure.
    The optimization part the of defuzzification method was further developed during 2007. A method based on Difference of Convex functions (DC programming), in combination with convex-concave regularization, as a deterministic approach for solving the optimization problem imposed by defuzzification by feature distance minimization, was developed an evaluated. This work was presented at the ISPA conference in September 2007. Exploration of the Spectral Projected Gradient method as an alternative optimization method was initiated and continues in 2008.

  8. Decomposition of 3D objects
    Stina Svensson, Magnus Gedda
    Funding: Swedish Research Council (Project 621-2005-5540); SLU S Faculty; UU TN Faculty
    Period: 9801-
    Abstract: Methods for decomposition of 3D discrete objects as well as grey-level representations of proteins (see Project 12) have earlier been developed at CBA. These methods have been further developed by utilising the concept of fuzzy sets. The application in mind is Cryo-ET data of proteins, but the method is general and can be used as a blob separation algorithm for 2D or 3D grey-level images in applications where grey-levels are increasing towards the internal parts of the blobs. By using fuzzy sets, the inner properties of the structure is enhanced, thus, aiding decomposition. The decomposition scheme combines fuzzy distance information from the fuzzy object and fuzzy distance based hierarchical clustering of local maxima (see Project 3) with a region growing process to identify the parts of the fuzzy object. This approach shows promising results. An article describing the decomposition scheme was published in Pattern Recognition Letters during 2007.
    The decomposition scheme make use of the reverse fuzzy distance transform as a region growing method. During 2007, the properties of the reverse fuzzy distance transform was further investigated, both as a region growing method and in the context of centres of maximal fuzzy balls. The latter is of interest when developing skeletonization algorithms in a fuzzy setting. Some preliminary results was presented at 8th International Symposium on Mathematical Morphology (ISMM) and published in the proceedings from the symposium.

    Analysis of microscopic biomedical images

  9. New objective quantitative analysis techniques for quantification of tissue regeneration around medical devices
    Gunilla Borgefors, Joakim Lindblad, Hamid Sarve
    Funding: SLU, S Faculty, Swedish Research Council
    Period: 0503-
    Partner: Carina Johansson, Dept. of Clinical Medicine, Örebro University
    Abstract: In order to evaluate how tissue reacts on implants, the interface between the implant and the tissue must be studied. Today, this procedure is done manually in a microscope.
    The aim of this project is to develop automatized image analysis methods for analyzing images of the junction of tissue and implant. This method shall make the procedure more effective as well as giving an objective estimation.
    The analysis involves segmentation of the images in different tissue-types and measurement of some relevant measures such as length, area and volume.
    Before the analysis, methods that shall remove artifacts be applied. Differences in graylevels, color and possibly texture features will be used for the recognition. Known methods will be used to present the result.
    Results from this project was presented at the 12th International Conference on Computer Analysis of Images and Patterns (CAIP'07) in August. See Figure 4.

    Figure 4: A 3D-rendering of a preliminary segmentation of the commercially pure titanium implant inserted in rabbit-tibia bone into implant (dark blue) and surrounding bone material (light yellow). The implant was imaged using SRCT imaging technique.
    Image rendering
  10. Analysis of skeletal muscle fibers in three dimensional images
    Patrick Karlsson, Ewert Bengtsson, Joakim Lindblad
    Funding: Swedish Research Council, 2007-2009
    Period: 0603-
    Partners: Anna-Stina Höglund, Alexander Cristea, Jingxia Liu, Lars Larsson, Dept. of Neuroscience, UU Hospital
    Abstract: A detailed 3D spatial description of the organization of myonuclei in healthy and diseased human muscle cells can be a useful tool for understanding the underlying mechanisms of muscle wasting associated with, e.g., neuromuscular disorders, and aging. The current poor understanding of the spatial arrangement of myonuclei is to be remedied by an interdisciplinary collaboration between CBA and the Muscle Research Group (MRG), UU. This project develops and evaluates methods for modeling and quantitative analysis of 3D distributions of myonuclei by utilizing the proficiency of modern confocal microscopic techniques to create true 3D volume images. Advanced computerized modeling of the elongated generalized cylinder structure of the imaged muscle cells is paramount in investigating the myonuclear domain, i.e., each finite volume in which a myonucleus controls the gene products. The complex topological conditions put on 3D models and measurement methods, compared to 2D equivalents, are a challenge in developing appropriate image analysis tools and algorithms. The project currently involves comparison of muscle fibers between different species, and comparison of human muscle fibers with relation to a patients age, and the muscle genotype. The project was presented in 2007: as an oral presentation at The European Muscle Conference in Stockholm, as a poster at Medicinteknikdagarna i Örebro, and as a poster at the Biophysical Society, Bethesda, USA. A conference paper on a nuclei segmentation method has been submitted.

    Figure 5: A: A 2D-slice of a skeletal muscle fiber from rat. The red signal represents the fiber sarcomere, and the blue represents the nuclei. B: A maximum intensity projection of the nuclei perpendicular to the imaging plane. C: Iso-surface of the fiber signal. D: 3D-view of the nuclei signals with estimated centroid position based on local intensity maximums. E: Retrieved nuclei centroids, based on D.
    Image patrick_project

  11. Fully automatic heart beat rate determination in digital video recordings of rat embryos
    Khalid Niazi, Ewert Bengtsson
    Funding: COMSATS Institute of Information Technology, Islamabad, Pakistan
    Period: 0702-
    Partners: Mats Nilsson, Bengt Danielsson, Div. of Toxicology, Dept. of Pharmaceutical Biosciences, UU
    Abstract: The technique of whole embryo culture of rodents (where rat and mouse embryos can be cultured outside the uterus) has been used for over four decades to study adverse effects of chemicals and drugs on embryonic development. A major advantage of whole embryo culture is that development can be directly monitored during organogenesis. For instance the presence of heart rate and blood circulation, a sign of a healthy embryo, is normally monitored at different times during culture. Usually this is done manually under a light microscope where the culture flask is placed and the heart rate is determine by simply counting the number of heart beats for a period of time. The assessment involves determination of the heart rate of the embryo which is usually done visually, a technique which is tedious and error prone. We have developed a new method, which in the first phase increases the signal to noise ratio by masking the boundary of the moving embryo with the help of directional filter bank. Later, information from sampling frequency is used to detect the location of the heart in the embryo. As a last step, cross-correlation is used to find a one-dimensional signal, where number of peaks in the signal corresponds to the number of heart beats. Currently, we are focused on automatic arrhythmia detection from these videos.

  12. Automated extraction of geometrical features of proteins from cryo electron tomographic data
    Stina Svensson, Magnus Gedda
    Funding: Swedish Research Council (Project 621-2005-5540); SLU S Faculty; UU TN Faculty
    Period: 0401-
    Partners: Dept. of Cell and Molecular Biology (CMB), Karolinska Institutet, Stockholm; Dipartimento di Energetica "S. Stecco" and Dipartimento di Fisica, Universitá di Firenze (UF), Florence, Italy; Laboratoire de Biophysique (LB), Statistique ITP/SB, Ecole Polytechnique Fédérale de Lausanne, Lausanne, Switzerland, Medical Research Council Centre (MRCC), Cambridge, United Kingdom
    Abstract: State of the art imaging techniques makes it possible to study individual proteins and other macromolecules from a structural point of view. Descriptions with respect to geometry and shape facilitates studying protein dynamics. This type of study is essential to increase the understanding of their biological role. CMB has developed methods, using cryo electron tomography (Cryo-ET), for 3D imaging of individual proteins at a resolution of approximately 2 nm. Moreover, they have together with UF and LB developed methods for modelling protein dynamic based on the images. Fitting a model to each protein in the image has so far been done manually. For large-scale studies, computerized image analysis serves as an essential tool to automatically and objectively fit the protein model to image content. In this project, we develop methods to fill the gap between image and model and thereby make large-scale studies of the movement of proteins possible. We will develop methods for automatically extracting the geometrical features needed as input to the models. This will be done taking into account both grey-level information (which reflects the internal structure of the protein) and 3D shape information.
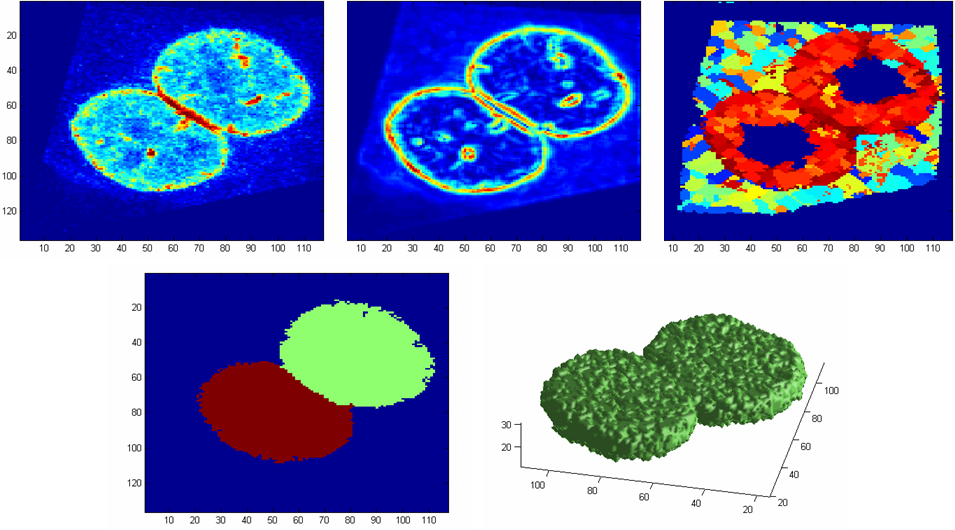
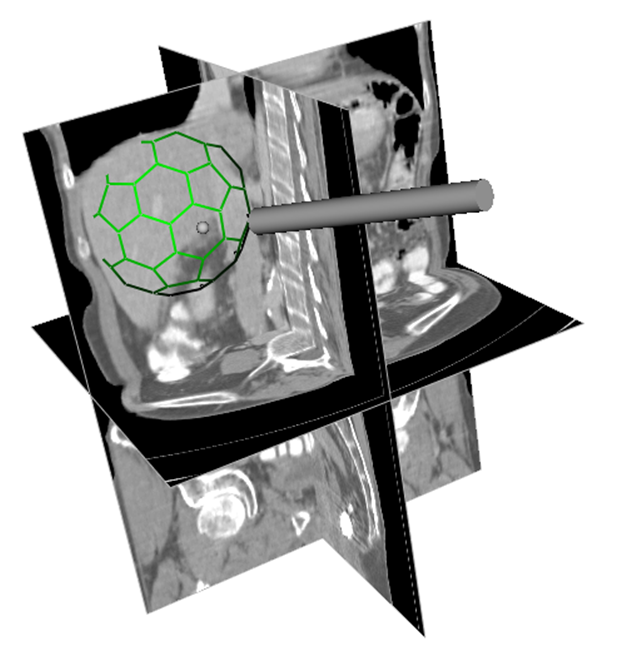
    The first step in this process is to identify the different parts of the protein. This is of interest as the parts and their relative positions are the key to understanding how flexible a protein is and how it can interact with, or bind to, other proteins or substances. During 2007, a decomposition method, theoretically described in Project 8, was published in Pattern Recognition Letters.
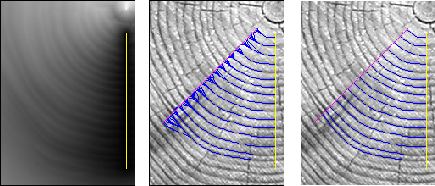
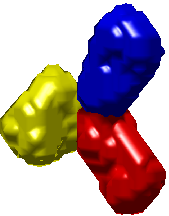
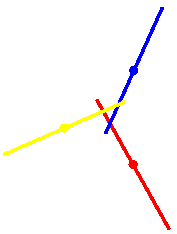
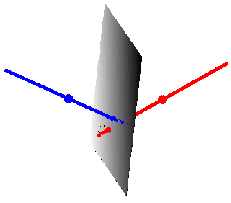
    Once the parts (or domains) of a protein are identified, the next step is to extract relevant geometrical features. During 2007, we developed a method to extract the interdomain angles and the translation of the domains with respect to each others for the Immunoglobulin G (IgG) antibody imaged by Cryo-ET. The IgG antibody consists of three parts, the Fc stem and the two Fab arms. The parts are approximately equal in size. We compared the results with X-ray cristallography experiments for the same structure and could conclude that, even though Cryo-ET gives images of lower resolution than X-ray cristallography, the mentioned geometrical features can be extracted with high significance. This work was done in close cooperation with UF and LB and published in Journal of Microscopy. In Figure 6, one IgG antibody, which has been constructed from information stored in the Protein Data Bank (http://www.pdb.org/), illustrates the method: to the left, the IgG antibody decomposed into Fc stem and Fab arms; in the middle, the principal components of each parts used for measuring the interdomain angles; and to the right, the Fab-Fab dyad in which the translation between the domains are measured.

    Figure: For PDB code 1IGY constructed at 20 Å resolution: surface rendering of the Fc stem (yellow) and the Fab arms (red and blue); PC , PC , and PC; and Fab dyad, PC , and PC .
     Image JMi_fig6a Image JMi_fig6b Image JMi_fig6c

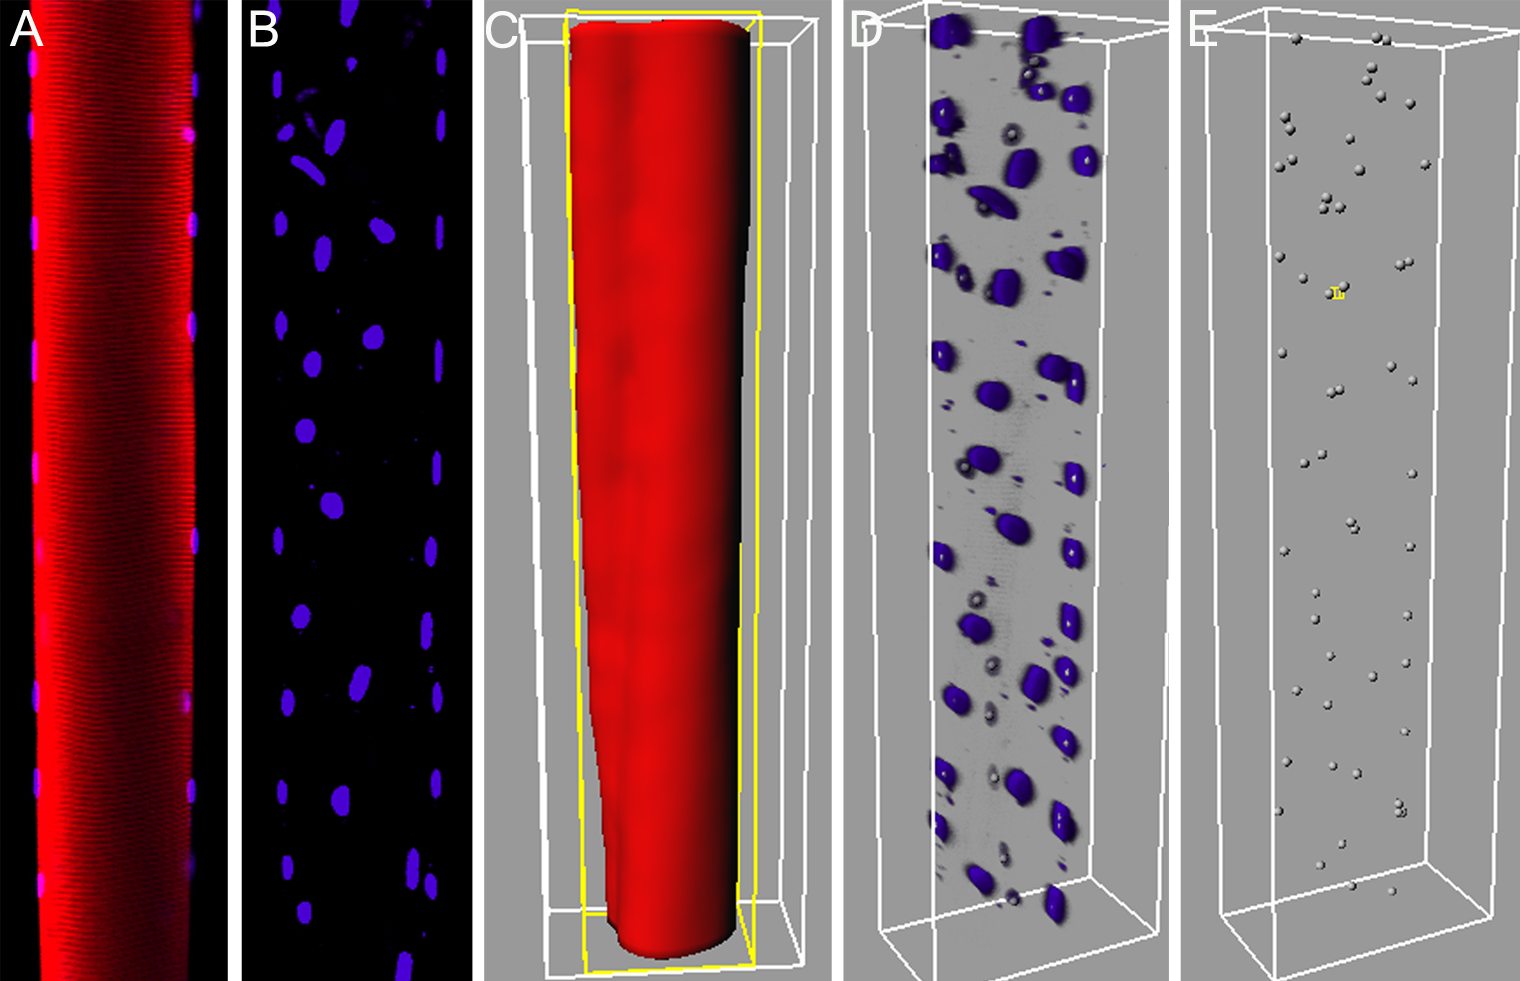
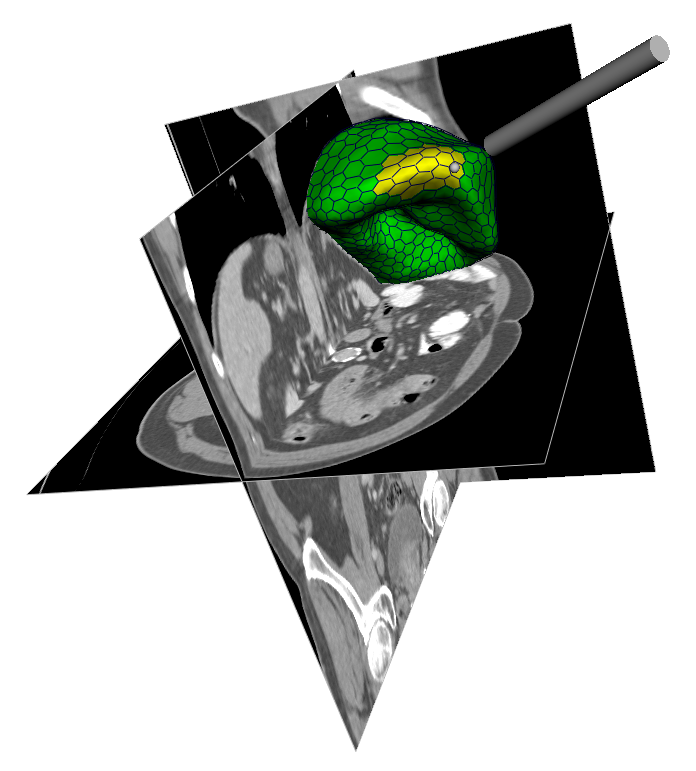
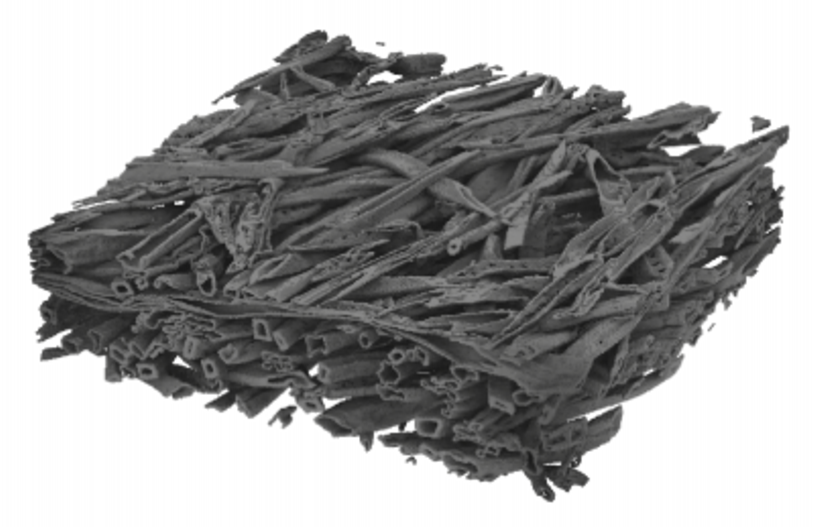
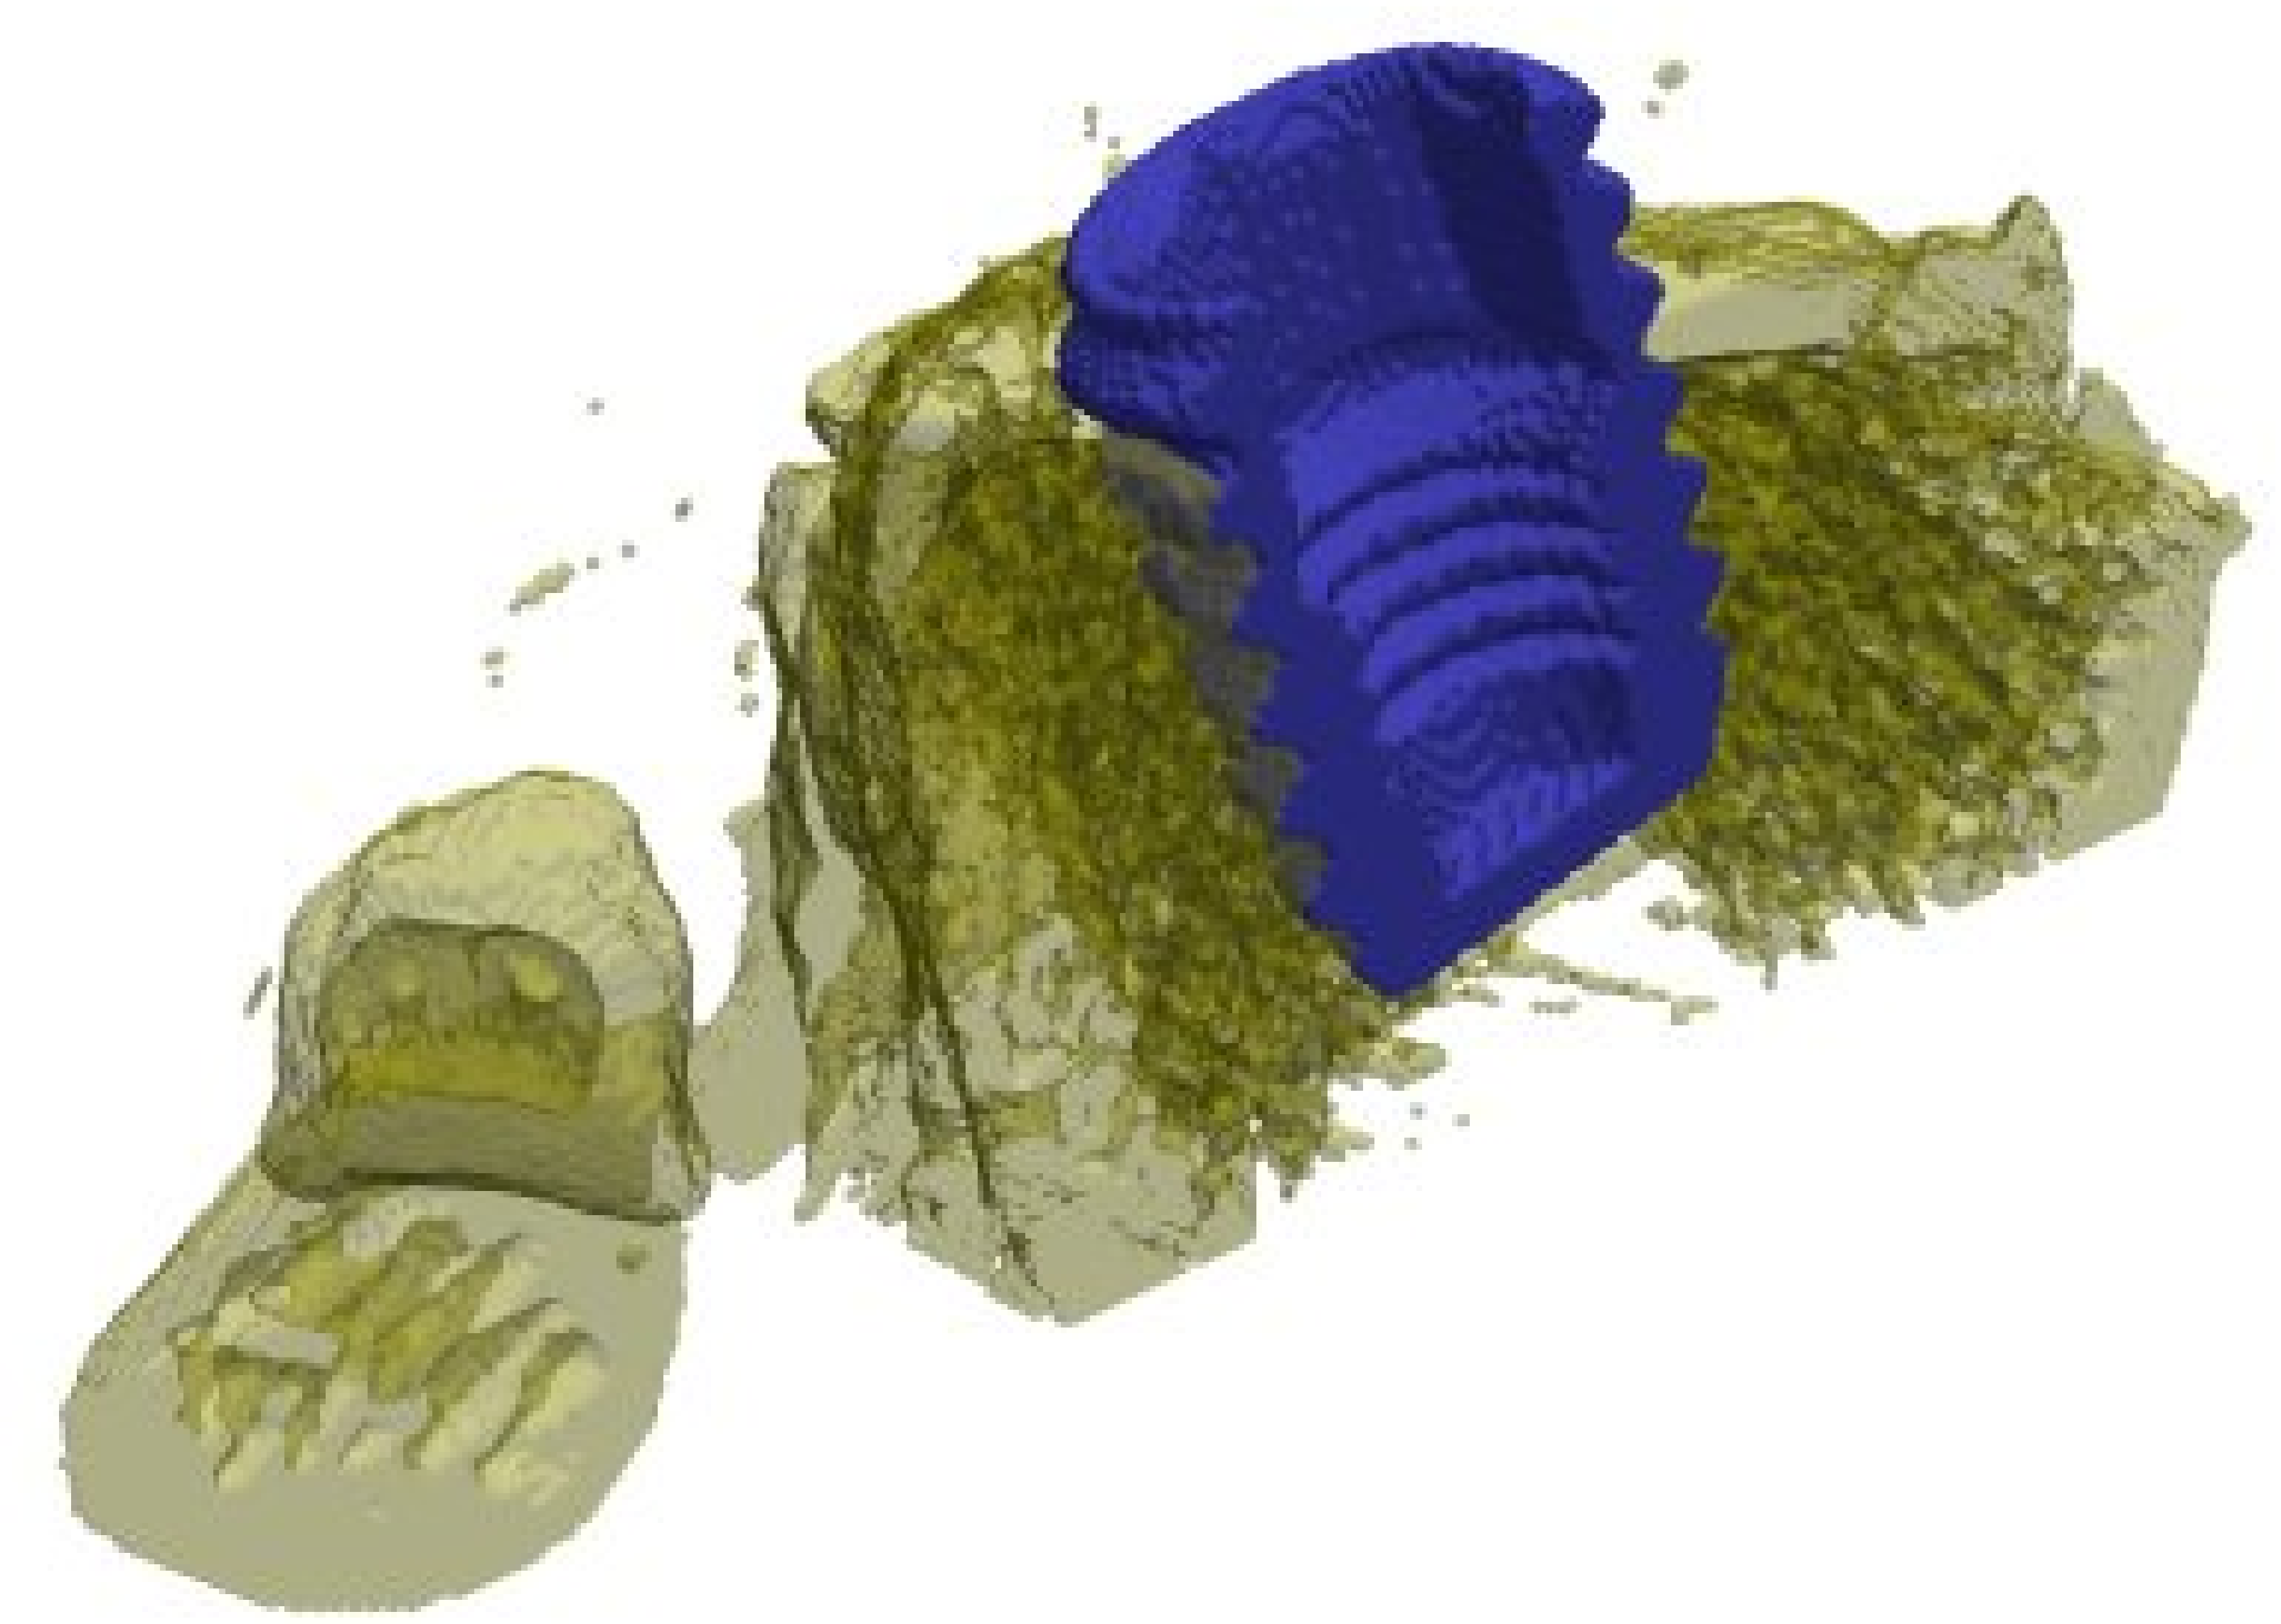
    The decomposition method is also used in a study of another protein, namely the Met tyrosine kinase receptor. This is done in cooperation with with MRCC, UF, and LB. The Met protein controls growth, invasion, and metastasis in cancer cells and activating Met mutations predispose to human cancer. It has a unique biological role and is therefore of interest to study. In its mature form, Met consists of an extracellular chain and a longer chain. The chain and the first part of the chain folds to a propeller structure. This propeller region is sufficient for the binding to its ligand, hepatocyte growth factor / scatter factor (HGF/SF). The remaining part of the chain is called stalk, due to its stalk-like structure. The stalk is, for the moment, understood to hold the propeller in correct orientation for the ligand binding. To get a better understanding of the biology behind, a quantitative study of the 
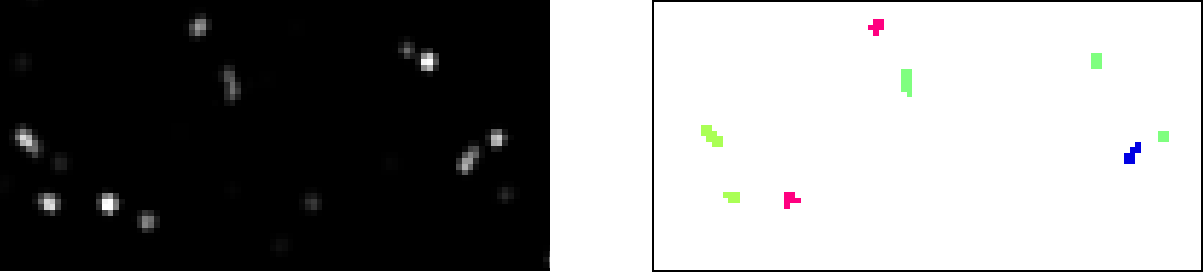
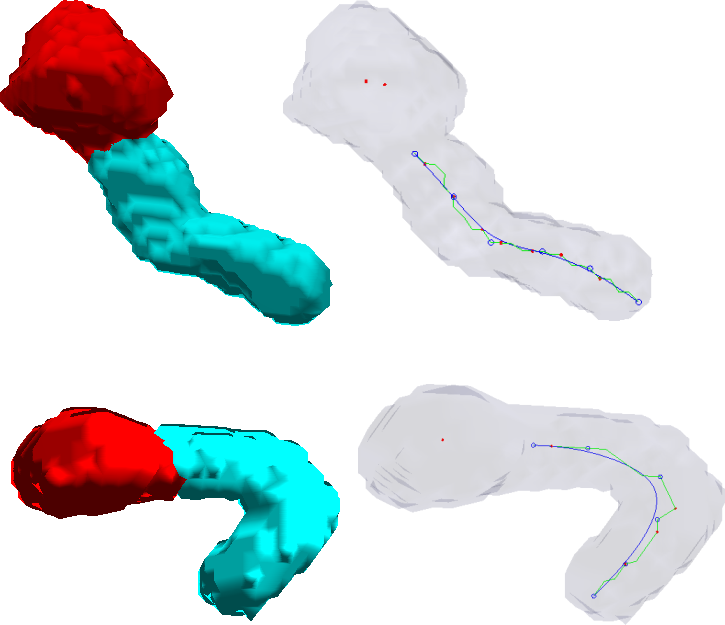
flexibility of the stalk for Met. During 2007, a method for identifying the propeller and the stalk and to extract a representation, a stalk curve suitable for extracting geometrical features regarding its flexibility was presented at 12th International Conference on Computer Analysis of Images and Patterns and published in the proceedings from the conference. In Figure 7, the method is illustrated by two examples.

    Figure 7: Two MET proteins decomposed into -propeller (red) and stalk (cyan), and their respective stalk curves.
    Image met24nurb

  13. Segmentation and analysis methods for cytology
    Amalka Pinidiyaarachchi, Carolina Wählby, Ewert Bengtsson
    Funding: SIDA
    Period: 0605-
    Partner: N. Rantatunga, Dept. of Pathology, University of Peradeniya, Sri Lanka
    Abstract: In many biomedical applications quantitative measurements of stained nuclei of both cytological and histological samples are used in aid of decision making by the expert. The digital images produced in such processes are in color and segmentation of specific regions of such images is an area that has been widely studied. A project is carried out in collaboration with the Dept. of Pathology, Faculty of Medicine, University of Peradeniya, Sri Lanka where thyroid smear samples are expected be analyzed. The image processing goal to be achieved is the development of successful color image segmentation methods. This involves tests in different color spaces, selection of a good segmentation method and dealing with heavily clustered cell nuclei segmentation. The biological goal in the study is to use the methods effectively in extracting various features of cell nuclei that can be used in expert decision making process. Extensions of watersheds to color images where color gradient measures and statistical comparison with neighborhood are used are to be tested on the images in further studies.
  14. Segmentation and analysis of point-like fluorescent signals in 2D and 3D images of cells
    Amalka Pinidiyaarachchi, Amin Allalou, Carolina Wählby
    Funding: EU-Strep Project ENLIGHT (ENhanced LIGase based Histochemical Techniques), SIDA
    Period: 0305-
    Partners: Malin Jarvius, Chatarina Larsson, Katerina Pardali, Ola Söderberg, Irene Weibrecht, Mats Nilsson, Dept. of Genetics and Pathology, UU
    Abstract: The interior of a cell is elaborately subdivided into many functionally distinct compartments, often organized into intricate systems. One way of studying such compartments is by the use of different fluorescent markers that bind specifically to the objects of interest, in this case padlock- and proximity probes. This type of staining followed by imaging through a fluorescence microscope results in point-source signals, together with compartment-specific stains, background noise and autofluorescence. 3D images are acquired by making non-invasive serial optical sections of the object. Analysis of spatial relationships in 2D and 3D requires pre-processing followed by signal detection and segmentation of cell compartments combining intensity and shape information. Once the signals are detected, the goal is to analyze spatial relationships and non-random patterns in the signal distribution. See Figure 8.

    Figure 8: Top: Central slice of an original image, the 3D Sobel-filtered image, and initial result after seeded watershed segmentation in 3D. Bottom: The final segmentation after region merging and 3D view of segmentation result.
    Image THREED_cell_seg

  15. Image based measurements of single cell mtDNA mutation load
    Amin Allalou, Carolina Wählby
    Period: 0608-
    Funding: EU-Strep Project ENLIGHT (ENhanced LIGase based Histochemical Techniques)
    Partners: Anton K. Raap, Frans M. van de Rijke, Roos Jahangir Tafrechi, Dept. of Molecular Cell Biology, Leiden University Medical Center, The Netherlands; Visiopharm, Hørsholm, Denmark
    Abstract: Cell cultures as well as cells in tissue always display a certain degree of variability, and measurements based on cell averages will miss important information contained in a heterogeneous population. An automated method for image based measurements of mitochondiral DNA (mtDNA) mutations in individual cells has been implemented and integrated as a part of the VIS image analysis platform. The methods are used on a daily bases in the continued work on mutation load analysis at Leiden University Medical Center in the Netherlands. The development of image based single cell analysis will continue to be in focus in the ongoing ENLIGHT project.
  16. Quantification and localization of colocalization
    Milan Gavrilovic, Carolina Wählby
    Period: 0611-
    Funding: EU-Strep Project ENLIGHT
    Abstract: In fluorescence microscopy, during image acquisition of multiply labeled specimen, two or more of the emission signals can often be physically located in the same area or very near to one another in the final image due to their close proximity within the microscopic structure. This is known as colocalization. Colocalization is particularly important for revealing information on how and where bio-molecules such as proteins and protein complexes interact within a cell, as well as in which sub-cellular structures they are present. If red and green fluorochromes are selected colocalization will appear as yellow emission. Existing methods for quantification and localization of colocalized pixels have been implemented and compared. At the same time new methods for detection of cross-talk and colocalization based on spectral decomposition have been developed. The method for cross-talk suppresion and localization of colocalization are expected to be tested in real image situations.

  17. Analysis of random array data
    Carolina Wählby
    Funding: Uppsala BioX
    Period: 0501-
    Partners: Jenny Göransson, Mats Nilsson, Dept. of Genetics and Pathology, UU
    Abstract: Nilsson et al. are developing new methods for molecular analyses that allow analysis at the ultimate level of single bio-molecules through padlock- and proximity probing coupled to rolling-circle amplification. Rolling-circle products spontaneously form micron-sized coils (blobs) that can be immobilized randomly on a glass surface, referred to as a random blob array. Blobs are identified by hybridization of fluorescence labeled tag-oligonucleotides. Therefore, individual detection oligonucleotides act as biotransistors that convey and amplify the information from the nanometer-sized probe molecules to observable micron-sized products. In this project, the goal is to use combinations of fluorescent molecules on single detection oligonucleotides, as well as repeated staining and de-staining, in order to create image data that can be analyzed for simultaneous identification of many different types of DNA fragments, transcripts, and proteins. The position of the reaction sites of a random blob array are random. In order to classify the blobs, they are first detected by a combination of filtering and morphological operations. Methods based on spectral decomposition are thereafter used for blob classification, see Figure 9.

    Figure 9: Left: Zoom in on a small part of a maximum intensity projection of the random array. A typical array contains approximately 5000 blobs. Right: Blob identities represented by different colors after classification based on spectral decomposition. Weakly fluorescing blobs are discarded if the signal pattern has low confidence.
    Image AR_input

  18. BlobFinder; a tool for fluorescence microscopy image cytometry
    Amin Allalou, Carolina Wählby
    Funding: Olink Bioscience, EU-Strep Project ENLIGHT
    Period: 0702-0712
    Abstract: Image acquisition can be performed at a very high rate with modern fluorescence microscopy hardware, giving rise to a demand for high-speed data analysis. There are numerous image analysis software that can perform a wide array of different measurements. However, the multi-application capability often compromises the simplicity of the tool. Also, the gain in speed of analysis is often compromised by time spent learning complicated software and understanding input parameters. Together with Olink Bioscience our aim was to create a free, single-application and user-friendly software that primarily should be provided to the customers of Olink Bioscience. The software, called BlobFinder, can localize and quantify point like source signals and cells in fluorescence microscopy images, e.g., from FISH, in-situ PLA and padlock probes. BlobFinder can be downloaded from http://www.cb.uu.se/~amin/Blobfinder.

  19. Parallax error correction in retinal image registration
    Khalid Niazi, Ewert Bengtsson
    Funding: COMSATS Institute of Information Technology, Islamabad, Pakistan
    Period: 0711-
    Partners: Albert Alm, Dept. of Neuroscience, UU Hospital
    Abstract: Retinal image is one of the main sources in ophthalmology to study the optical nerve head and the retina. Retinal images are often used for analyzing, diagnosing and treating a number of diseases of the human retina. Image registration plays an important role in determining the progression of retinal illness. In the current project we are in a process of developing a new method which will help in evaluation of glaucoma progression. We are specially concentrating on correction of parallax error, which is normally produced due to change in angular position of the camera. We believe that directional information will play a major role in correct registration of these retinal images. Our plan is to automatically find the points where the vascular structure interests the optic disc, and then use these points for registration purpose.

    3D analysis and visualization

  20. Improved interactive medical image analysis through haptic display methods
    Erik Vidholm, Ewert Bengtsson, Ingela Nyström, Stefan Seipel, Filip Malmberg
    Funding: Swedish Research Council, UU TN Faculty
    Period: 0301-
    Partners: Lennart Thurfjell, GE Healthcare, Uppsala/London, UK; Gunnar Jansson, Dept. of Psychology, UU; Hans Frimmel, Dept. of Oncology, Radiology, and Clinical Immunology, UU Hospital
    Abstract: Modern medical imaging techniques provide 3D images of increasing complexity. Better ways of exploring these images for diagnostic and treatment planning purposes are needed. Combined stereoscopic and haptic display of the images form a powerful platform for such image analysis.
    In order to work with specific patient cases, it is necessary to be able to work directly with the medical image volume and to generate the relevant 3D structures directly as they are needed for the visualization. Most work so far on haptic display has used predefined object surface models. In this project, we are creating the tools necessary for effective interactive exploration of complex medical image volumes for diagnostic or treatment planning purposes through combined use of haptic and 3D stereoscopic display techniques. The developed methods are tested on real medical application data.
    Our current applications are interactive liver segmentation from CT images, see Project 21, and hardware assisted visualization of breast MR images, see Project 22. In additon to this, we are working on haptic interaction with 3D deformable surface meshes and 3D live-wire from a more theoretical point of view.

  21. Interactive liver segmentation from CT images
    Erik Vidholm, Ingela Nyström, Ewert Bengtsson
    Funding: Swedish Research Council, UU TN Faculty
    Period: 0501-
    Partners: Sven Nilsson, Hans Frimmel, Dept. of Oncology, Radiology, and Clinical Immunology, UU Hospital
    Abstract: The manual step in semi-automatic segmentation of medical volume images typically involves initialization procedures, such as placement of seed-points or positioning of surface models inside the object to be segmented. The initialization is then used as input to an automatic segmentation algorithm. We investigate how such initialization tasks can be facilitated by using haptic feedback.
    In this project, we develop interactive methods for segmenting the liver from CT scans of patients with neuroendocrine tumors. Liver segmentation is of importance in hepatic surgery planning, where it is a first step in the process of finding vessels and tumours, and the classification of liver segments. Liver segmentation may also be useful for monitoring patients with liver metastases, where disease progress is correlated to enlargement of the liver.
    Figure 10 illustrates a tool for interactive 3D liver segmentation using deformable surface models represented by simplex meshes. The interaction is performed directly in 3D with the haptic device. We use volume haptics to convey information about the volumetric data used for external force computations. This helps us to better understand the data and adjust the deformation weights. It is also possible to interact directly with the mesh during deformation. By pointing the haptic probe like a torch at the mesh, vertices and faces in a user-specified neighbourhood are selected and forces can be applied to the selected sub-mesh only. We performed an experiment where 10 segmentations of the liver from CT data was performed. The segmentation results show high sensitivity and specificity when compared to manual delineations made by a radiologist.
    The results were presented at the MICCAI 2007 Workshop: Interaction in Medical Image Analysis and Visualization, in Brisbane.

    Figure 10: Left: A user working with the haptic display. Middle: Initialization of the deformable model with a sphere. Right: A user interacting with the model by applying forces to a selected part of the mesh using the haptic device.
    Image erikhaptik Image meshinit Image defmod_interaction

  22. Analysis of dynamic breast MRI
    Ewert Bengtsson, Erik Vidholm, Ingela Nyström
    Funding: UU TN Faculty, The Australian Research Council
    Period: 0503-
    Partners: Stuart Crozier, Andrew Mehnert and co-workers at the ITEE Department, University of Queensland, Brisbane, Australia
    Abstract: The pattern of change of signal intensity over time in contrast enhanced magnetic resonance (MR) images of the breast is a useful indicator of malignancy. The methods used for assesing and visualizing this in current clinical practice are rather tedious; it is difficult to visualise and evaluate 4D (3D volumes over time) data effectively. During his sabbatical at the University of Queensland in 2004-2005, Bengtsson joined a new project in this area which developed into a collaborative project which is continuing. A basic concept for the visualisation is to convert the time course for each voxel into a colour coded representation where intensity and saturation represents the uptake of contrast and hue represents the washout which is different for normal and malignant tissue. We thus obtain a colour coded volume image. During 2006, a program where this image is visualized with hardware accelerated maximum intensity projection (MIP) in the hue-saturation-value (HSV) colour space was developed. The program was further improved during 2007 and a version which also allows for drawing regions of interest was installed in Brisbane to be used for validation studies. The project was presented at the workshop on interaction in medical image visualization in conjunction with MICCAI 2007 in Brisbane.

  23. Interactive exploration of medical images for visualization on standard PC hardware
    Suthakar Somaskandan, Ingela Nyström, Ewert Bengtsson
    Funding: SIDA
    Period: 0409-
    Abstract: Several of the medical imaging systems provide 3D volume information, e.g., CT, MRT, SPECT, and ultrasound. This is very useful since the human body is 3D. However, to reach a diagnostic conclusion, the 3D images need to be projected onto the 2D computer screens in more sophisticated ways than slice by slice projections. It is particularly useful to device methods where the user interactively can explore the 3D information in the images. Earlier, allowing dynamic interaction with medical volume images of realistic, clinically useful resolution required very expensive display stations driven by high-performance computers. Today, a PC equipped with a high-end standard graphics card can be used quite effectively for the purpose of medical visualization. The research task in this project is to develop effective display methods for exploring medical data by utilizing GPU programming. For health reasons this project has been idle during 2007.

  24. Efficient algorithms for computer graphics
    Ewert Bengtsson
    Funding: UU TN Faculty
    Period: 9911-
    Partners: Anders Hast, Dept. of Mathematics, Natural Sciences, and Computing, University College of Gävle; Tony Barrera, Barrera Kristiansen AB, Uppsala
    Abstract: Computer graphics is increasingly being used to create realistic images of 3D objects. Typical applications are in entertainment (animated films, games), commerce (showing 3D images of products on the web which can be manipulated and rotated), industrial design, and medicine. For the images to look realistic high quality shading and surface texture and topology rendering is necessary. Many fundamental algorithms in this field were developed already in the early seventies. The algorithms that produce the best results are computationally quite demanding (e.g., Phong shading) while other produce less satisfactory results (e.g., Gouraud shading). In order to make full 3D animation on standard computers feasible, high efficiency is necessary. We are in this project re-examining those algorithms and are finding new mathematical ways of simplifying the expressions and increasing the implementation speeds without sacrificing image quality. The project is carried out in close collaboration with Tony Barrera, an autodidact mathematician. It has been running since 1999 and resulted in around 25 international publications and a PhD thesis. During 2007 the work resulted in a book chapter on trigonometric splines which will appear in 2008.

  25. Collaborative 3D visualizations
    Stefan Seipel, Lars W. Pettersson
    Funding: UU TN Faculty
    Period: 0309-0712
    Partners: Swedish Defense College; Dept. of Information Technology, UU; University College of Gävle
    Abstract: In many important decision situations, more than only one stakeholder is concerned with the analysis and interpretation of the decisive data. Often, the data collected is very complex, it may be organized in several orthogonal dimensions or is ordered in multiple independent layers. Our technical means to efficiently visualize this complexity are limited to the two-dimensional grid of colored pixels on a computer screen. In this current project we investigate how we optimally can design visualizations that support more collaborating users who interact simultaneously with the same visualization in the same place. We use a rather unique display technology (in collaboration with and at the Swedish Defense College, FHS) to present up to 8 individual pictures at the same display surface. It allows to selectively controlling, which picture(s) are seen by individual users. In this environment we study the effects of several features of advanced visualizations, which are dynamic observer conditions, stereoscopic cues, and layer separated visualizations.

    Forestry related applications

  26. Image analysis of the internal paper structure and cellulose based composite materials in 3D images
    Maria Axelsson, Filip Malmberg, Stina Svensson, Joakim Lindblad, Gunilla Borgefors
    Funding: SLU S Faculty
    Period: 0406-
    Partners: Norwegian Pulp and Paper Research Institute (PFI), Trondheim, Norway; STFI-Packforsk, Stockholm; KTH Fibre and Polymer Technology, Stockholm; Dept. of Physics, University of Jyväskylä (UJ), Finland
    Abstract: The internal structure of paper is important to study since many material properties correspond directly to the properties of single fibres and their interaction in the fibre network. How single fibres in paper bond and how this effects paper quality is not fully understood since most structure analysis of paper has been performed in cross sectional two dimensional (2D) images and paper is a complex three dimensional (3D) structure, see Figure 11.
    Figure 11: A screenshot from a tool, developed using VTK, for quick visual inspection of volume images of fibrous materials.
    Image window
    Another application for wood-fibres that has recently gained a lot of interest is wood polymer composite materials. The properties of these materials do not only depend on the structure of the fibre network, but also on interaction between the fibres and the polymer matrix surrounding the fibres. Advances in imaging technology has made it possible to acquire 3D images of paper and wood polymer composite materials. In this project, image analysis methods for characterising the 3D material structure in such images are developed. The detailed knowledge of the material structure attainable with these methods is useful for improving material properties and for developing new materials. An example slice from a binarised volume and a surface rendering of a sample of a composite material image with X-ray microtomography are shown in Figure 12 (top).
    The project objective is to achieve a complete segmentation of individual fibres and pores in volume images of the material. Given such a segmentation, any measurement of the internal structure is available. Measurements on individual fibres and the structural arrangement of fibres can then be related to macroscopical material properties. Other methods for measuring properties of the material, that do not require a complete segmentation of the samples, are also investigated.
    In this project, different volume images of paper and composite materials are available for the studies. This includes one volume created from a series of 2D scanning electron microscopy (SEM) images at StoraEnso in Falun and X-ray microtomography volume images of paper and composite samples imaged at the European Radiation Synchrotron Facility (ESRF) in Grenoble, France and at the Paul Scherrer Institut (PSI) in Villigen, Schweiz. Furthermore, methods for creating other sample volume images are investigated.
    During 2007, the project has resulted in one publication. A method for tracking individual fibres in volume image data, which gives estimates of the fibre centre line and the cross sectional dimensions of each fibre, was presented at the International Conference on Image Processing (ICIP) 2007. See Figure 12 (bottom) for examples of two tracking results. In the project, a method for measuring the fibre orientation in volume image data is under development. Other ongoing research regards improved binarization of phase-contrast microtomography images, and automatic measurement of fibre-fibre contact.
    During the year, we have initiated cooperation with University of Jyväskylä (UJ). One commonly used method to measure porosity in porous materials such as paper and composite is by Mercury Intrusion Porosimetry (MIP). The group in UJ has recently developed an image analysis method to simulate the intrusion and extrusion process in MIP based on skeletonization of the pore space. At CBA we make use of a watershed based segmentation of the pore space to do the same simulation. Initial studies on images generated using a SkyScan microtomography instrument show that the two methods give comparable results, and that they can be used as an alternative to MIP.
    An application to WoodWisdom on "WoodFibre3D" was approved during late 2007. The project starts in 2008. This ensures a continuation and expansion of the fibre application projects during the coming three-year period.

    Figure 12: Top: A slice from a binarised volume image of a composite material and a surface rendering of a sample of a composite material. Bottom: Tracking results obtained for two individual fibres.
    Image binary Image karin8_4_ao2

    Image tracking_result

  27. Log end feature extraction of untreated wood logs in saw mill environment
    Kristin Norell, Stina Svensson, Gunilla Borgefors
    Funding: Swedish Timber Measurement Council (VMR), SLU S Faculty
    Period: 0505-
    Partners: Swedish Timber Measurement Council (VMR), Dept. of Forest Products, SLU
    Abstract: The wood quality of a log can be determined, to some extent, by examining the log end. Such analysis is mostly performed manually at saw mills, where the log scaler has a couple of seconds to determine features like the approximate annual ring density, presence of rot and presense of compression wood. By using computerized image analysis application instead, the analysis can be more robust. In this project methods to measure important properties of logs in saw mill environment using computerized image analysis is developed. Some interesting features are: The images used are log end images of norway spruce and scots pine taken in a saw mill environment. The logs are sawn with a regular harvester or chain saw. Images used so far are picked to represent a large variety of features that can occur.
    Pith position is found using filters to detect local orientation, Hough transform, and a final adjustment technique. Once the pith is found some other measurements will be easy, and others will be facilitated. The pith detection method has been submitted for journal publication.
    Work has started on detection of annual rings, using the pith detection method and the grey weighted polar distance transform (GWPDT), see Project 4. Figure 13 shows preliminary results for an end face image with the computed distance image and minimum cost paths. By using the intensity image as a cost function for the GWPDT, the annual rings can be outlined. This end face is of high quality. More work must be done for the method to become successful also on end faces with less visible rings.
    A camera for imaging log end faces has been installed at a Swedish sawmill during 2007, to produce a large and representative image material for the project. The camera has a color sensor and images end faces on-line as the logs pass on a conveyor.
    Figure 13: The GWPDT applied on a log end image with annual ring pattern. The origin is in the upper right, and the object pixels, from where the GWPDT has been computed, are marked pixels on the vertical line below the origin.
    Left: Distance image ($218 \times 158$ pixels). Middle: Shortest paths to the object from pixels marked on the diagonal line from the origin to the lower left of the image. Right: The shortest path to each of the end pixels in the object.
    Image DTrings

  28. Detection of rot in end faces of wood logs
    Kristin Norell, Stina Svensson, Gunilla Borgefors
    Funding: SLU S Faculty, Stiftelsen Mauritz Carlgrens fond
    Period: 0612-
    Partners: Kim Dralle, Anders Björholm Dahl at Dralle A/S, Copenhagen, Denmark
    Abstract: This project focus on image analysis methods for identifying rot in log end faces. The purpose is to detect rot already while harvesting, or when the logs are in a stack waiting for transport. Logs are depicted using a standard color digital camera that can be mounted on a harvester or a vehicle. The goal is to find a robust method for detecting rot in timber suitable for practical use.

  29. Quantification of the quality of wood fibres
    Bettina Selig, Gunilla Borgefors
    Funding: SLU S Faculty
    Period: 0709-
    Abstract: Wood fibre quality is important for many uses of this raw material. The quality can be tested by various microscopy methods, where different fibre properties are qualitatively and/or quantitatively measured. In this project, we will develop automatic quantitative image analysis of single wood fibres.
    Usually, the substance lignin is located between the individual wood cells but sometimes it also deposits in the cell walls. This is an undesirable condition, because if these fibres are processed to paper, the lignin in the cell walls causes bad quality. For this reason the percentage of the lignin in the cell shall be estimated to quantify the quality of the wood fibres. For this project images with glowing lignin created with a fluorescence microscope are used, see Figure 14. The goal is to estimate the size of the cell and the amount of the lignin in the cell using image analysis methods.
    In a second part of the project, the damage of single fibres (breaks, cracks, distortions etc.) shall be characterized and classified. And in a third part the thickness of the middle lamella shall be estimated. For both problems polarized light microscopy images will be applied.

    Figure 14: Fluorescence microscopy image of wood cells. The lignin appears brighter, so it can be seen that in this sample the lignin is not only between the cells but also within the cell walls.
    Image Fluor-9-small
    Remote sensing
  30. Nordkalotten satellite evaluation co-operation network (NorSEN)
    Tommy Lindell
    Funding: UU TN Faculty, Dept. of Infrastructure, KTH, Stockholm
    Period: 0406-
    Partners: Kai Sörensen, Norwegian Institute for Water Research (NIVA); Terry Callaghan, Abisko Scientific Research Station (ANS), Fredrik Bergholm
    Abstract: Field measurements were performed on Lake Torneträsk, and near Abisko. From June 2004, spectrometer measurements were run by Fredrik Bergholm on the arctic vegetation around Abisko Naturvetenskapliga Station (ANS), and spectral measurements were performed by Tommy Lindell and Kai Sörensen on Lake Torneträsk. The field measurements have continued during the years 2005-2007. Fredrik Bergholm has been measuring with spectrometers, among other things from the ski lift in Abisko. Tommy Lindell and Kai Sörensen has been taking water samples for analyses, made manual recording of spectral characteristics and have had a floating device on Torne Träsk for spectral measurements during the summer months. Tommy Lindell has collected and analysed satellite data from the lake. Kai Sörensen has been using ships on Hurigrutten for continuous sampling of spectral information and water quality variables. These field measurements have contributed to the data base for the Scandinavian NorSEN project, which formally started in 2005. The project deals with validation of satellite images in polar-near areas, and build-up of ground- based spectral sensors around ANS. Little scientific work has been done before on the use of satellite data in polar-near areas, with low sun angles and special atmospheric conditions. The project aims to find normalisation and correction measures of the satellite data for these areas.

  31. Digital video and camera in remote sensing of water variables
    Tommy Lindell
    Period: 0001-
    Partners: CNR, Milan, Italy
    Abstract: Test of the usefulness of air-borne digital camera and video for mapping water variables. Lindell has been constructing a holder for the digital video/camera for small aircrafts.
    Data have been collected from Lakes Erken and Mälaren, from coral bottoms in Bisceyne National Park and for mapping of Lake Garda, Italy. The test in Italy led to new vibration reduction to the holder to improve image quality.
    Recently, tests of the usefulness of those images have been performed for the classification of the Swedish coastline.

  32. Surtsey and Capelinhos, two contemporary submarine volcanoes
    Tommy Lindell
    Funding: UU TN Faculty
    Period: 0703-
    Abstract: Capelinhos, close to the Island of Faial in the Azores in the middle of the Atlantic, began to erupt on the 27 of September 1967 from 4 submarine vents after a couple of days with seismic activities. The outbreak of magma started a violent eruption of ash, lapilli and steam when it interacted with the sea water. This continued until May 1958. The first two cones collapsed after a few months but the third cone still remains. is located most westerly of the island of Faial.
    The island of Surtsey was formed in a volcanic eruption which began 130 meters below sea level, and reached the surface on 14 November 1963. The eruption lasted until 5 June 1967, when the island reached its maximum size of 2.7 km. Wind and wave erosion has diminished the island in size to about 1.4 km today. Like as for the Capelinhos, eruptions created more islands from the vents, Jólnir and Syrtlingur but as in the case for Capelinhos those two islands disappeared soon.
    Wind and waves are the main factors eroding these two volcanic features. They are now approximately half a century old, resting in two similar locations but within two rather different climatological systems as to their wave and wind climate. One intriguing question is then of course if the environment may have had any major differentiating effect on the present shape of the islands. This is under investigation, based on satellite imagery and aerial photos and climatological data. Other projects
  33. The development of a general image analysis software platform
    Bo Nordin, Ewert Bengtsson
    Funding: UU TN Faculty
    Period: 8807-
    Abstract: In image analysis research it is important to have a good platform for interactive work with digital images. We have therefore for many years had a supporting "background" project in which we have been developing and maintaining a flexible platform for image analysis work to which new modules easily can be added. The first version of the system, IMP, was based on a commericial collaboration project in which around 10 man-years were invested and it has been used extensively in our research and education over the years. Recently, a new C++ based version, Pixy, has been created. However, due to lack of resources and time, this version is not yet complete and the work has during 2007 primarily been focused on supporting the needs of specific projects.


next up previous contents
Next: Cooperation partners Up: Research Previous: Research   Contents