- Skeletonization in 3D discrete binary images
Robin Strand, Ingela Nyström, Gunilla Borgefors, Stina Svensson
Funding: UU TN Faculty, Graduate School in Mathematics and Computing (FMB), SLU S Faculty
Period: 9501-
Partners: Gabriella Sanniti di Baja, Istituto di Cibernetica, CNR, Pozzuoli, Italy; David Brunner, Chemnitz University of Technology, Chemnitz, Germany
Abstract:
Skeletonization is a way to reduce dimensionality of digital objects. A skeleton should have the following properties: topologically correct, centred within the object, thin, and fully reversible. In general, the skeleton can not be both thin and fully reversible. We have been working on 3D skeletonization for the last decade.
Topology preservation is guaranteed by removing only simple points. Usually, a condition based on the number of connected components in a small neighbourhood is considered to test whether a grid point is simple or not. Such a condition for grid points on the body-centered cubic (bcc) grid is presented and proven to be correct in the report Simple points on the body-centered grid, see 6.5.7. In the report, another condition for directional thinning is also proven to be correct. The condition is used to develop a directional thinning approach in A high-performance parallel thinning approach using a non-cubic grid structure, see 6.5.8. The resulting skeleton is a curve skeleton that is thin, but not reversible.
- Distance functions and distance transforms in discrete images
Robin Strand, Céline Fouard, Gunilla Borgefors, Stina Svensson
Funding: SLU S Faculty, Graduate School in Mathematics and Computing (FMB)
Period: 9309-
Partner: Benedek Nagy, Dept. of Computer Science, Faculty of Informatics, University of Debrecen, Debrecen, Hungary
Abstract:
The distance between any two grid points in a grid is defined by a distance function. The distance functions considered in this project (in contrast to Project 3) only depend on the positions of the grid points. During 2006, two kinds of path-generated distance functions are considered in this project. For path-generated distance functions, the distance between two points is defined as the shortest path between the points. To define paths between points, an adjacency relation and the cost (weight) for a step between two neighbouring grid points must be defined. The rotational dependency can be minimized either by using predefined weights (weighted distances) or by varying the adjacency relation along the path (distance based on neighbourhood sequences).
By combining weighted distances with distance based on neighbourhood sequences, a distance function with very low rotational dependency is obtained. Some theoretical results about such distance functions have been derived in two manuscript submitted for publication.
Weighted distance functions and distance transforms have been examined in a very general framework -- modules and point-lattices, respectively. The paper describing these results has been accepted for publication in Pattern Recognition.
Distances based on neighbourhood sequences on the fcc and bcc grids, see Project 4, have also been examined. This research has resulted in a number of publications, see e.g. 6.3.9. The manuscripts include both results on the basic theory for such distance functions and "optimal'' (minimizing the rotational dependency) neighbourhood sequences, see Figure 2.
In a distance transform (DT), each picture element in an object is labeled with the distance to the closest element in the background. Thus the shape of the object is "structured" in a useful way. Only local operations are used, even if the results are global distances. DTs are very useful tools in many types of image analysis, from simple noise removal to advanced shape recognition. In the DT obtained when using distances based on neighbourhood sequences, the distance values consitutes a layer-by-layer structure. The set of grid points having the same distance value constitutes a Jordan surface (or several Jordan surfaces). A Jordan surface separates the the set of grid points into two connected sets  and
and  such that is not connected with . The DTs obtained when using distances based on neighbourhood sequences on the squre, cubic, bcc, and fcc grids are examined in Generating distance maps with neighbourhood sequences, 6.3.15.
Figure 2:
The asymptotic shape of balls when the optimal (the maximal absolute difference with a Euclidean ball is minimized) neighbourhood sequences are used for fcc (left) and bcc (right). Euclidean balls are shown to illustrate the error function that is used.).
|
|
- Comparison of gray weighted distance measures
Céline Fouard, Magnus Gedda
Funding: SLU S Faculty; UU TN Faculty
Period: 0601-
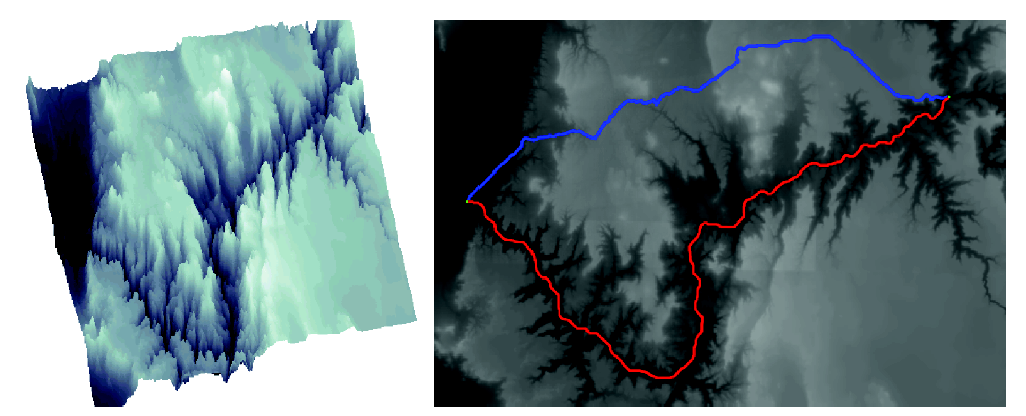
Abstract: In several application projects we have discovered the benefit of computing distances weighted by the gray levels traversed, e.g., project 12. There are many ways of doing this, and in this project we have made a thorough comparison of the distances calculated with Gray Weighted Distance Transforms (GWDT) and the Weighted Distance Transforms On Curved Spaces (WDTOCS). A small example of shortest paths is found in Figure 3. The work was presented at Discrete Geometry for Computer Imagery (DGCI'06) and published in the proceedings from the conference. The next step is to do a through examination of the performance of the underlying algorithms in these calculations.
Figure 3:
A height map of Grand Canyon, surface rendered (left) and with GWDT path (red) and WDTOCS path (blue) overlaid (right).
 |
- Image processing and analysis of 3D images in the bcc and fcc grids
Robin Strand, Gunilla Borgefors
Funding: Graduate School in Mathematics and Computing (FMB)
Period: 0308-
Partners: Christer Kiselman, Dept. of Mathematics, UU; Peer Stelldinger, University of Hamburg, Germany; Benedek Nagy, Dept. of Computer Science, Faculty of Informatics, University of Debrecen, Debrecen, Hungary
Abstract:
The main goal of the project is to develop image analysis and processing methods for volume images digitized in non-standard 3D grids. Volume images are usually captured in one of two ways: either the object is sliced (mechanically or optically) and the slices put together into a volume or the image is computed from raw data, e.g., X-ray or magnetic tomography. In both cases, voxels are usually box-shaped, as the within slice resolution is higher than the between slice distance. An image acquisition method, the Direct Fourier method has been developed for non-standard grids during 2006, see 6.3.14.
Before applying image analysis algorithms, the images are usually interpolated into the cubic grid. However, the cubic grid might not be the best choice. In two dimensions, it has been demonstrated in many ways that the hexagonal grid is theoretically better than the square grid. The body-centered cubic (bcc) grid and the face-centered cubic (fcc) grid are the generalizations to 3D of the hexagonal grid. In the bcc grid, the voxels consist of truncated octahedra, and in the fcc grid, the voxels consist of rhombic dodecahedra. The fcc grid is a densest packing, meaning that the grid points are positioned in an optimally dense arrangement. The fcc and bcc grids are reciprocal, so the Fourier transform on an fcc grid results in a bcc grid. In some situations, the densest packing (fcc grid) is preferably in the frequency domain, resulting in a bcc grid in spatial domain. In some cases, the densest packing is prefered in the spatial domain.
Some results about topology preserving digitization with the fcc and bcc grids were presented at IWCIA (see 6.3.13). The results show that especially the fcc grid is by far better than the cubic grid in this aspect. Other aspects of topology-preserving digitization on the fcc grid have also been examined, but are not yet published.
- Fuzzy shape analysis in 2D and 3D
Ingela Nyström, Joakim Lindblad, Gunilla Borgefors
Funding: SLU S Faculty, UU TN Faculty
Period: 0109-
Partners:
Nataša Sladoje (Matic), Faculty of Engineering, University of Novi Sad, Serbia;
Abstract: The advantages of representing objects in images
as fuzzy spatial sets are numerous and have lead to increased
interest for fuzzy approaches in image analysis. Fuzziness is an
intrinsic property of images and a natural outcome
of most imaging devices. Preservation of fuzziness implies
preservation of important information about objects and images.
Our previous results within this project show that an improved precision
of a shape description can be achieved if the description is based on
a fuzzy, instead of a crisp shape representation, where the fuzzy
membership of a point reflects the level to which that point belongs to the object.
During 2006, a manuscript on the representation and reconstruction of fuzzy
disks by moments, containing derivation of theoretical error bounds for the
accuracy of the estimation of moments of a continuous fuzzy disk from the
moments of its digitization, as well as showing that, for a certain class of
membership functions, there exists a one-to-one correspondence between
the set of fuzzy disks and the set of their generalized moment representations,
was accepted for publication in the Fuzzy Sets and Systems journal.
- Defuzzification of fuzzy segmented objects by feature invariance
Ingela Nyström, Joakim Lindblad, Stina Svensson
Funding: SLU S Faculty, UU TN Faculty
Period: 0301-
Partners:
Nataša Sladoje (Matic) and Tibor Lukic, Faculty of Engineering, University of Novi Sad, Serbia
Abstract:
This project concerns the development of a method for feature based
defuzzification of spatial fuzzy sets. The developed method generates
crisp shapes from fuzzy shapes by finding a crisp shape at a minimal
distance to the fuzzy shape.
We define the distance between two fuzzy sets as a distance between their
feature-based representations in a chosen feature space.
We have found it appropriate for defuzzification to incorporate both
local and global features of the two sets. We have studied the use of
membership values, gradient, area, perimeter, and centre of gravity in
the distance measure.
Several existing distance measures can be used to define the distance measure
in the feature space. We have so far focused the research on Minkowski type
distances measure.
The defuzzification method was further developed during 2006.
A method for generating the crisp discrete representation of a fuzzy
set at an increased spatial resolution, compared to the resolution
of the fuzzy set, was developed and presented at the IWCIA conference
in June 2006.
Additional refinement of the method was achieved by the use of a scale space
approach, providing preservation of feature values over a range of scales
in the defuzzification process. Initial results from such an approach,
where area at a range of scales was used in the feature distance, were presented at
the DGCI conference in October 2006. That presentation also included
a practical implementation of the method for 3D data.
An example of defuzzification of a 3D data set
at increased resolution is presented in Figure 4.
Ongoing research regarding improvements of the optimization part of the
method, as well as practical application of the defuzzification method
to Cryo-ET data of proteins (see Project 12),
was also undertaken during 2006.
Figure 4:
Defuzzification of a bone region from a  CT volume image.
Slice through the image volume (a).
Slice through a fuzzy segmentation of the bone region in the image volume (b).
Slice through a defuzzification, using meso-scale volume features of the fuzzy segmented object (c).
3D rendering of the
CT volume image.
Slice through the image volume (a).
Slice through a fuzzy segmentation of the bone region in the image volume (b).
Slice through a defuzzification, using meso-scale volume features of the fuzzy segmented object (c).
3D rendering of the  -cut at smallest feature distance to the fuzzy object (d).
3D rendering of a high resolution defuzzification of the fuzzy segmented object (e).
The values
-cut at smallest feature distance to the fuzzy object (d).
3D rendering of a high resolution defuzzification of the fuzzy segmented object (e).
The values  below images (d) and (e) indicate the feature distance of the corresponding object
to the original fuzzy image.
below images (d) and (e) indicate the feature distance of the corresponding object
to the original fuzzy image.
|
|
- Decomposition of 3D objects
Stina Svensson, Magnus Gedda
Funding: The Swedish Research Council (project 621-2005-5540); SLU S Faculty; UU TN Faculty
Period: 9801-
Abstract:
Methods for decomposition of 3D discrete objects as well as grey-level representations of proteins (see Project 12) have earlier been developed at CBA. These methods have been further developed by utilising the concept of fuzzy sets. The application in mind is Cryo-ET data of proteins, but the method is general and can be used as a blob separation algorithm for 2D or 3D grey-level images in applications where grey-levels are increasing towards the internal parts of the blobs. By using fuzzy sets, the inner properties of the structure is enhanced, thus, aiding decomposition. The decomposition scheme combines fuzzy distance information from the fuzzy object and fuzzy distance based hierarchical clustering of local maxima (see Project 3) with a region growing process to identify the parts of the fuzzy object. This approach shows promising results. An article describing the theoretical part of this work was accepted to Pattern Recognition Letters and available on-line during 2006.
- Hierarchical chamfer matching algorithm
Stina Svensson
Funding: The Swedish Research Council (project 621-2005-5540); SLU S Faculty
Period: 0601-
Partner: Ida-Maria Sintorn, CSIRO Mathematical and Information Sciences, North Ryde (Sydney), Australia
Abstract:
Chamfer matching is a template matching method
based on geometric image features and can be used
for both 2D and 3D images. It finds good fits between the template
and edges in a search image. A generalized cost function between the
edges in the search image and the
template, a list of coordinate pairs corresponding to the searched
pattern, is minimized. To guide the template to good positions, a
distance transform (DT) is calculated from edges
in the search image and the sum of the distance values hit by the
superimposed template constitute the cost function. Translation,
scaling, rotation, and perspective changes are for 2D images and translation, scaling,
and rotation for 3D images. By embedding the chamfer matching in a resolution hierarchy (hierarchical chamfer matching algorithm, HCMA), the algorithm results in a fast, general and robust matching algorithm.
In this project, modifications of HCMA to even further improve its robustness are investigated. A first step is to use a distance weighted propagation of gradient magnitude (GM) as a cost image instead of the distance transform (DT) of a binarised edge image. The benefits are that no binarisation of the gradient magnitude image is needed, hence removing one step in the process and reducing the risk of loosing "true'' match positions by a poor binarisation method. This approach, hierarchical chamfer matching based on propagation of gradient strengths (GM-HCMA), was presented at Discrete Geometry for Computer Imagery (DGCI'06) and published in the proceedings from the conference. GM-HCMA also applied in Project 12, showing good results.
- The development of a general image analysis software platform
Bo Nordin, Ewert Bengtsson
Funding: UU TN Faculty
Period: 8807-
Abstract: In recognition of the need in image analysis research to have a good platform for interactive work with digital images, we several years ago
started a project with the aim of developing such a platform. The project
originally involved some 10 man years of work, which would have been
impossible to finance by regular research money. But through a cooperation
with a group of companies we co-ordinated our interests of obtaining a good
software platform for research with their interest in development of a new
software product. Unfortunately, the companies never actively turned the
resulting system, which was given the name IMP, into a product. At CBA,
however, the IMP system has been used as a software basis for most of the
teaching and research in image analysis for the last decade.
Some years ago, we started a major revision of the system as a "background
task'' for Nordin. The main goal was to re-program the core system in C++
to make it easier to maintain and extend. In 2002, we decided to write a
completely new program platform, Pixy, based on the new C++ core
and with all image analysis functions written in C++ in order to take
advantage of the C++-specific language constructs (classes, inheritance,
polymorphism, templates, etc.) to enhance the programmer's API and make the
code more reusable.
In Pixy, it is easy to add plug-in modules with new functionality and new
classes: several such modules have been implemented: MUSE (multivariate
segmentation) and filter editors for editing filters in the spatial domain
as well as in the Fourier domain. A first test version of Pixy was released internally at CBA during 2003 and a more complete version was released during 2006.
Analysis of microscopic biomedical images
- New objective quantitative analysis techniques for quantification of tissue regeneration around medical devices
Gunilla Borgefors, Joakim Lindblad, Hamid Sarve
Funding: SLU, S Faculty, Swedish Research Council
Period: 0503-
Partner: Carina Johansson, Dept. of Clinical Medicine,
Örebro University
Abstract: In order to evaluate how tissue reacts on implants,
the interface between the implant and the tissue must be studied. Today,
this procedure is done manually in a microscope.
The aim of this project is to develop automatized image analysis methods
for analyzing images of the junction of tissue and implant. This method
shall make the procedure more effective as well as giving an objective
estimation.
The analysis involves segmentation of the images in different
tissue-types and measurement of some relevant measures such as length,
area and volume.
Before the analysis, methods that shall remove artifacts be applied.
Differences in graylevels, color and possibly texture features will be
used for the recognition.
Known methods will be used to present the result. The interpretation of
the values however, will not be done by the postgraduate student.
This project will result in a number of publications (at conferences and
in technical and medical journals) about the new methods used as well as
the resulting measurement.
- Analysis of skeletal muscle fibers in 3D images
Patrick Karlsson, Ewert Bengtsson, Joakim Lindblad, Gunilla Borgefors
Period: 0603-
Partners: Anna-Stina Höglund, Jingxia Liu, Lars Larsson, Dept. of Neuroscience, UU
Abstract:
The need for understanding of the three dimensional (3D) spatial arrangement of myonuclei in
skeletal muscle fibers is great. A highly detailed 3D spatial description of the organization of
myonuclei in healthy and diseased human muscle cells enables detailed understanding of the
underlying mechanisms of muscle wasting associated with, e.g., neuromuscular disorders, and
aging. The current poor understanding of the spatial arrangement of myonuclei is to be
remedied by an interdisciplinary collaboration between the CBA
and the Muscle Research Group (MRG) at UU. This project develops
and evaluates methods for modeling and quantitative analysis of 3D distributions of
myonuclei by utilizing the proficiency of modern confocal microscopic techniques to create
true 3D volume images. Advanced computerized modeling of the elongated generalized
cylinder structure of the imaged muscle cells is paramount in investigating the myonuclear
domain, i.e., each finite volume in which a myonucleus control the gene products. The
complex topological conditions put on 3D models and measurement methods, compared to
2D equivalents, are a challenge in developing appropriate image analysis tools and
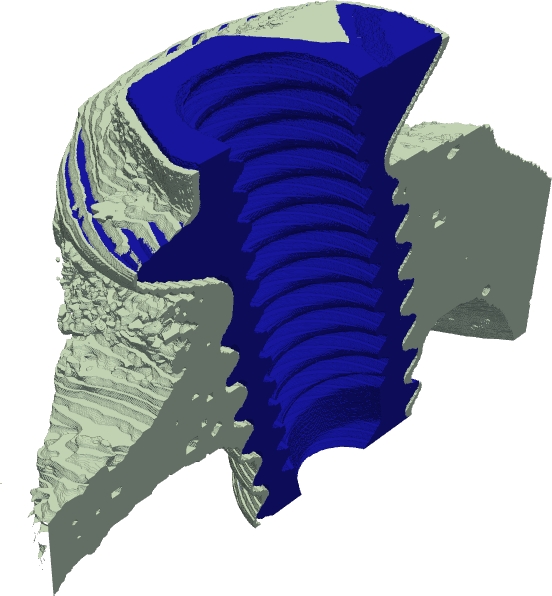
algorithms. The project was presented with a poster presentation at "Medicinteknikdagarna 2006'' in Uppsala.
Figure 5:
A 3D-rendering of a preliminary segmentation of the
commercially pure titanium implant inserted in rabbit-tibia bone into
implant (dark) and surrounding bone material (bright). The implant was
imaged using SRCT.
|
|
- Automated extraction of geometrical features of proteins from cryo electron tomographic data
Stina Svensson, Magnus Gedda
Funding: The Swedish Research Council (project 621-2005-5540); SLU S Faculty; UU TN Faculty
Period: 0401-
Partners: Dept. of Cell and Molecular Biology (CMB), Karolinska Institute, Stockholm; Dipartimento di Energetica "S. Stecco'' and Dipartimento di Fisica, Universitá di Firenze (UF), Florence, Italy; Laboratoire de Biophysique (LB), Statistique ITP/SB, Ecole Polytechnique Fédérale de Lausanne, Lausanne, Switzerland, Medical Research Council Centre (MRCC), Cambridge, United Kingdom.
Abstract:
State of the art imaging techniques makes it possible to study
individual proteins and other macromolecules from a structural point
of view. Descriptions with respect to geometry and shape facilitates
studying protein dynamics. This type of study is essential to increase
the understanding of their biological role. CMB has developed
methods, using cryo electron tomography, for 3D imaging of individual
proteins at a resolution of approximately 2 nm. Moreover, they have
together with UF and LB developed methods for modelling protein
dynamic based on the images. Fitting a model to each protein in the
image has so far been done manually. For large-scale studies,
computerized image analysis serves as an essential tool to
automatically and objectively fit the protein model to image
content. In this project, we develop methods to fill the gap between image and model
and thereby make large-scale studies of the movement of proteins
possible. We will develop methods for automatically extracting the
geometrical features needed as input to the models. This will be done
taking into account both grey-level information (which reflects the
internal structure of the protein) and 3D shape information.
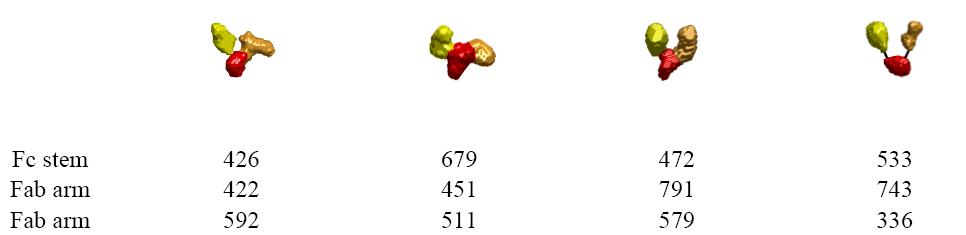
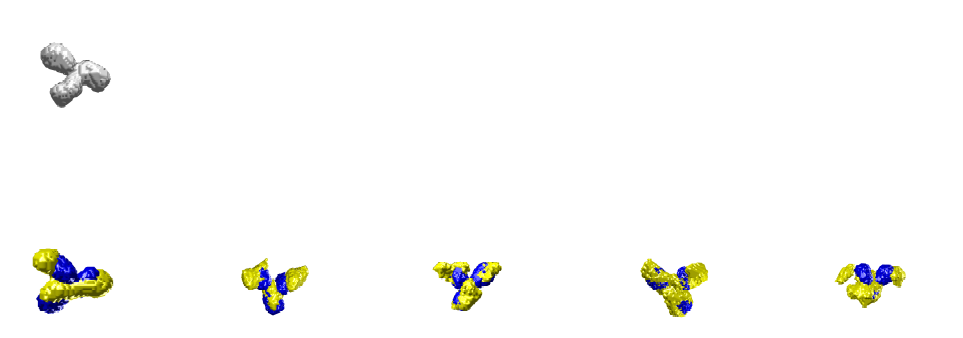
The first step in this process is to identify significant parts of the protein. This is of interest as the parts and their relative position is the key to understanding how flexible a protein is and how it can interact with, or bind to, other proteins or substances. During 2006, a method, theoretically described in Project 7 was presented at The International Conference on Pattern Recognition (ICPR) and published in the proceedings from the conference. The method was applied the Immunoglobulin G (IgG) antibody imaged by Cryo-ET. The IgG antibody consists of three parts, the Fc stem and the two Fab arms, and has a volume of 1500 voxels in the given sampling. The parts are approximately equal in size. In some cases, the connection (hinge) between a Fab and the Fc stem is not visible due to the resolution. Example are shown in Figure 6.
Figure 6:
Surface renderings of the IgG antibody with Fc stem shown in red and the two Fab arms in yellow and orange. The volume is given in number of voxels. In the rightmost case, the hinge region is not visible but the connection marked out (lengths are 23Å and 30Å).
|
The next step is to extract relevant geometrical features. This work was, for the IgG antibody, initiated during 2006 in cooperation with UF and LB. The features of interest are the interdomain angles and the translation of the domains with respet to each others.
Moreover, we have recently started to investigate another protein, namely the Met tyrosine kinase receptor. This is done in cooperation with with MRCC, UF, and LB. The Met protein controls growth, invasion, and metastasis in cancer cells and activating Met mutations predispose to human cancer. It has a unique biological role and is therefore of interest to study. In its mature form, Met consists of an extracellular chain and a longer  chain. The chain and the first part of the chain folds to a propeller structure. This propeller region is sufficient for the binding to its ligand, hepatocyte growth factor / scatter factor (HGF/SF). The remaining part of the chain is called stalk, due to its stalk-like structure. The stalk is, for the moment, understood to hold the propeller in correct orientation for the ligand binding. To get a better understanding of the biology behind, a quantitative study of the flexibility of the stalk for Met. During 2006, we have, using an approach similar to the above described, developed a method for identifying the propeller and the stalk. Furthermore, we have extracted a representation, a stalk curve suitable for extracting geometrical features regarding its flexibility. This work is described in a manuscript late 2006.
To find structures of interest in Cryo-ET data, a matching algorithm can be used. During 2006, an algorithm -- Hierarchical chamfer matching based on propagation of gradient strengths (GM-HCMA) -- was developed, see Project 8, and tested on Cryo-ET data of the IgG antibody. A template created from the Protein Data Bank was used. The results are illustrated in Figure 7. The work was presented at Discrete Geometry for Computer Imagery (DGCI'06) and published in the proceedings from the conference.
Figure 7:
Results when using GM-HCMA to find IgG antibodies in Cryo-ET data. The figure shows the used template (top) and positions found by GM-HCMA (bottom), all corresponding to true IgGs except the rightmost (found object in yellow, template in blue).
- Segmentation and analysis methods for cytology
Amalka Pinidiyaarachchi, Carolina Wählby, Ewert Bengtsson
Funding: SIDA
Period: 0605-
Partner: N. Rantatunga, Dept. of Pathology, University of Peradeniya, Sri Lanka
Abstract:
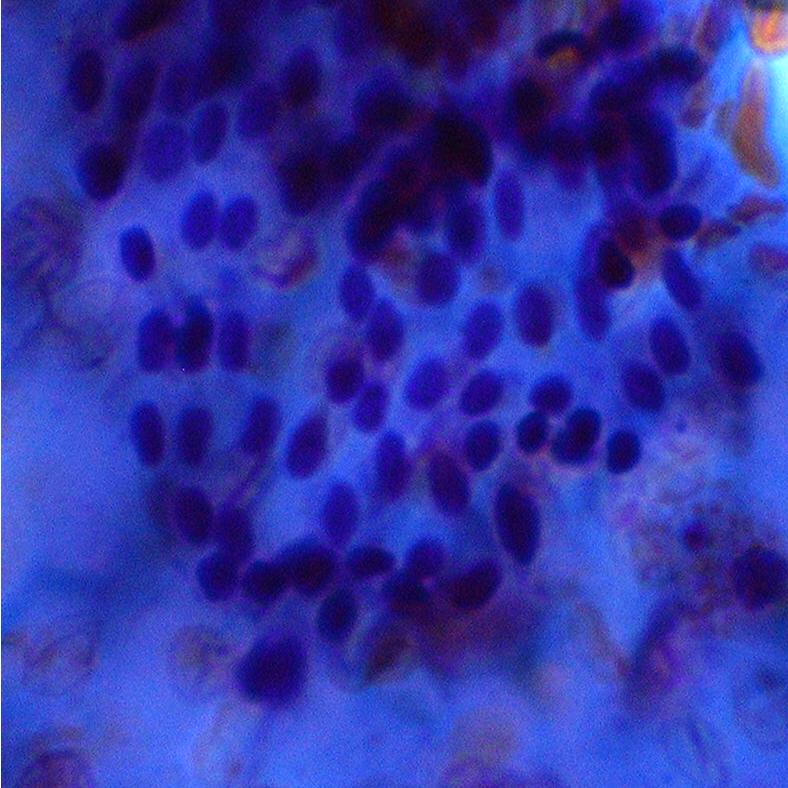
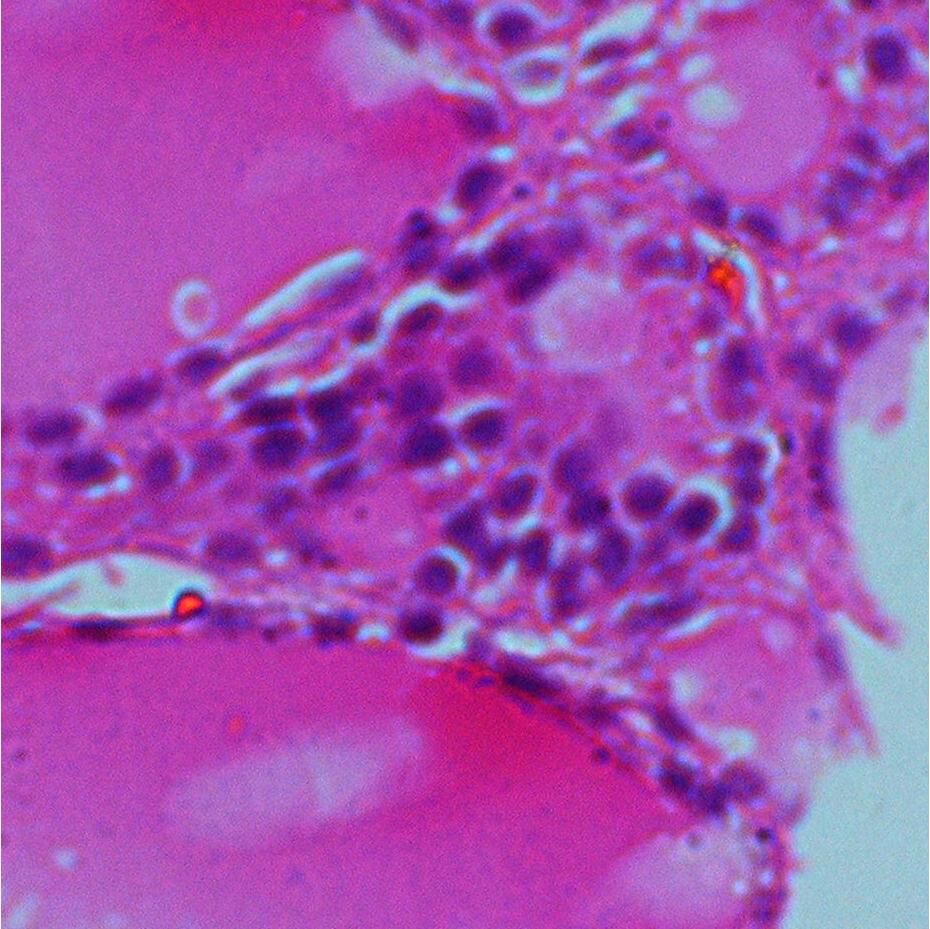
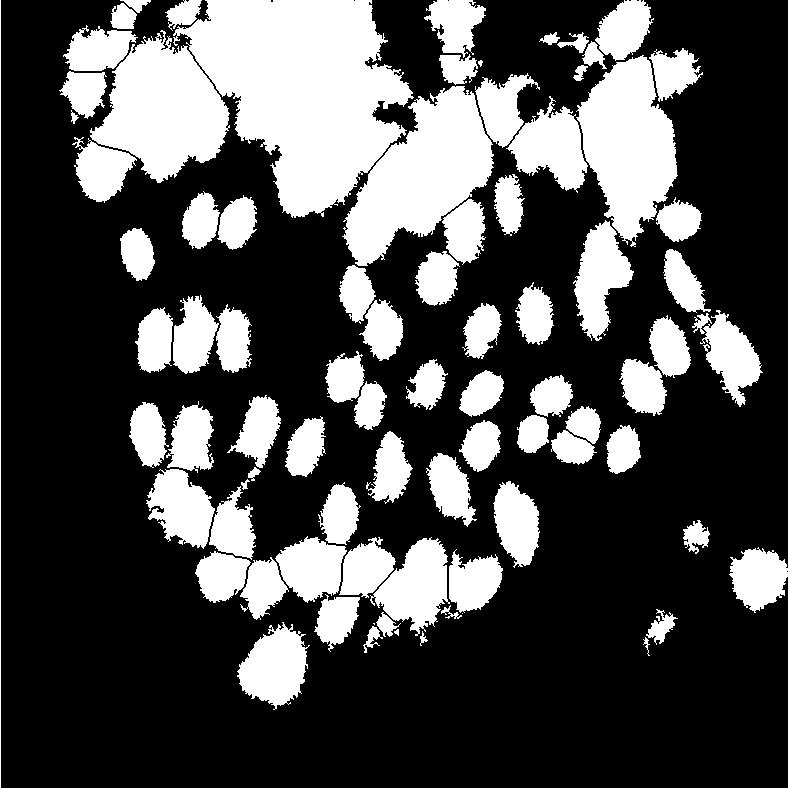
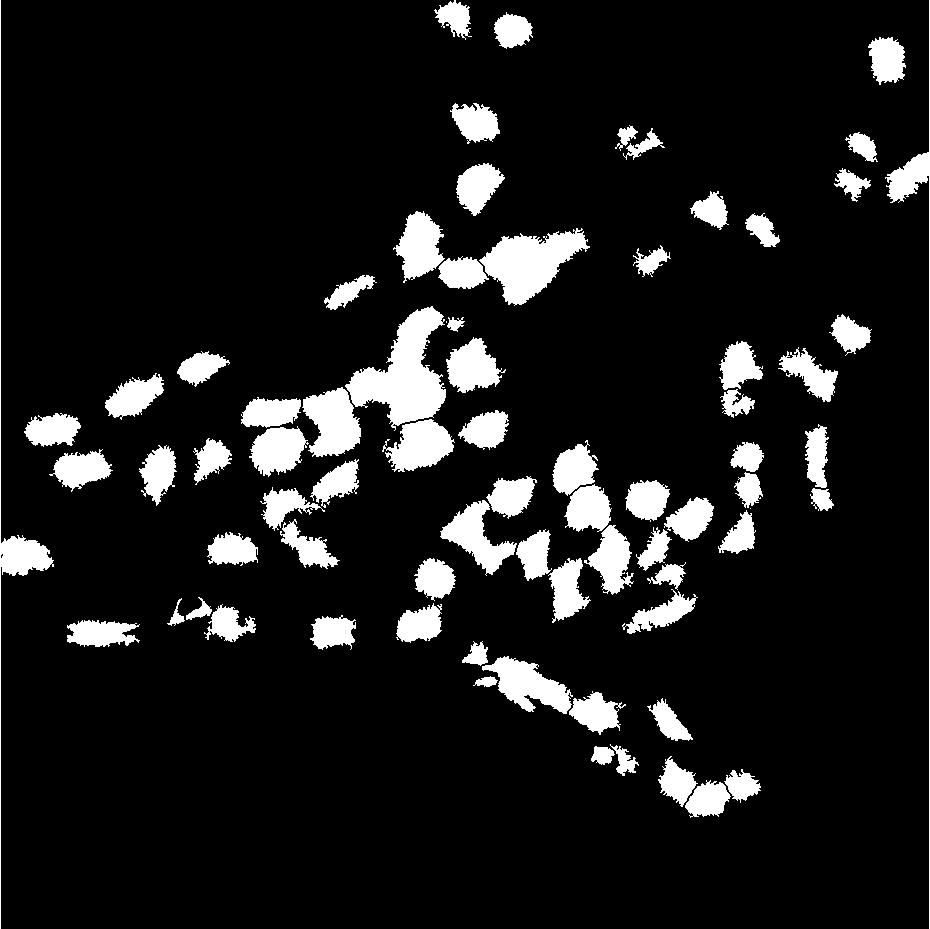
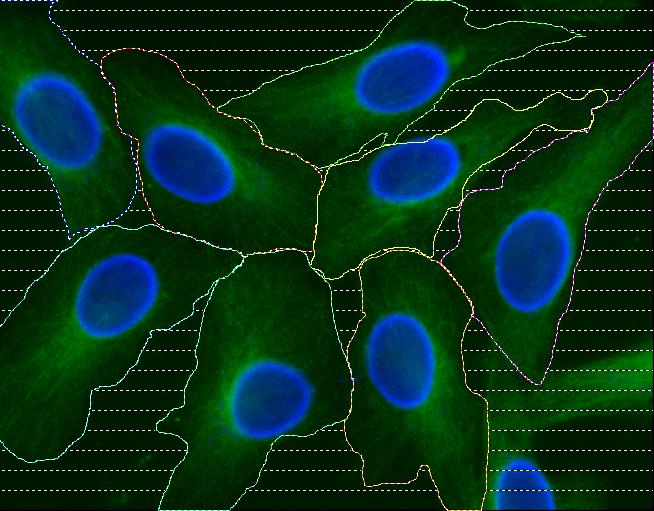
In many biomedical applications quantitative measurements of stained nuclei of both cytological and histological samples are used in aid of decision making by the expert. The digital images produced in such processes are in color and segmentation of specific regions of such images is an area that has been widely studied. A project is carried out in collaboration with the Dept. of Pathology, Faculty of Medicine, University of Peradeniya, Sri Lanka where thyroid smear samples are expected be analyzed. The image processing goal to be achieved is the development of successful color image segmentation methods. This involves tests in different color spaces, selection of a good segmentation method and dealing with heavily clustered cell nuclei segmentation. The biological goal in the study is to use the methods effectively in extracting various features of cell nuclei that can be used in expert decision making process. Figures 8 shows two sample images and the intermediate segmentation results after initial segmentation using color information followed by seeded watershed transform. Extensions of watersheds to color images where color gradient measures and statistical comparison with neighborhood are used are to be tested on the images in further studies.
Figure 8:
Segmentation result after applying seeded watershed segmentation method. The initial segmentation is based on the RGB color space.
|
|
- Segmentation and analysis of point-like fluorescent signals in 2D and 3D images of cells
Amalka Pinidiyaarachchi, Patrick Karlsson, Carolina Wählby, Ewert Bengtsson
Funding: UU TN Faculty, SIDA
Period: 0305-
Partners: Malin Jarvius, Chatarina Larsson, Mats Nilsson, Ola Söderberg, and Irene Weibrecht, Dept. of Genetics and Pathology, UU
Abstract:
The interior of a cell is elaborately subdivided into many functionally distinct compartments,
often organized into intricate systems. One way of studying such compartments is by the use of different
fluorescent markers that bind specifically to the objects of interest. This type of staining followed by
imaging through a microscope often results in point-source signals, or "blobs", together with a background
of noise and autofluorescence. 3D images are acquired by making non-invasive serial optical sections of the object.
Analysis of spatial relationships in 2D and 3D requires pre-processing
followed by separation and segmentation of the different blobs by combining intensity and shape information.
Once the different blobs are detected, the goal is to detect spatial relationships and non-random patterns in the blob distribution.
- Image based measurements of single cell mtDNA mutation load and evaluation of cytplasm segmentation
Carolina Wählby, Amin Allalou
Period: 0608-
Funding: EU-Strep project ENLIGHT (ENhanced LIGase based Histochemical Techniques)
Partners: Anton K. Raap, Frans M. van de Rijke, Roos Jahangir Tafrechi, Dept. of Molecular Cell Biology, Leiden University Medical Center, The Netherlands; Visiopharm, Hørsholm, Denmark
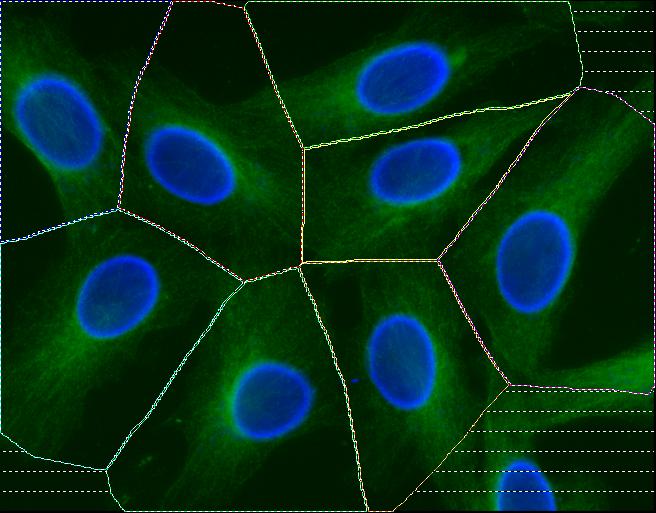
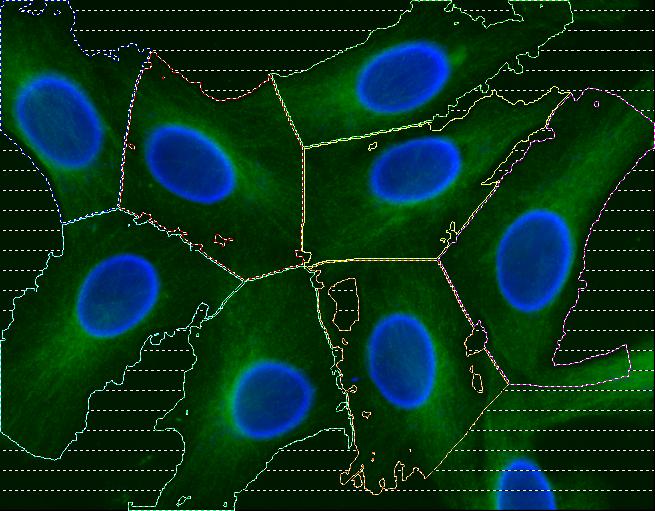
Abstract: Cell cultures as well as cells in tissue always display a certain degree of variability, and measurements based on cell averages will miss important information contained in a heterogeneous population. An automated method for image based measurements of mitochondiral DNA (mtDNA) mutations in individual cells has been implemented. The mitochondria are present in the cell's cytoplasm, and each cytoplasm has to be delineated. Three different methods for segmentation of cytoplasms were compared and it was shown that automated cytoplasmic delineation can be performed 30 times faster than manual delineation, with an accuracy as high as 87%. The final image based measurements of mitochondrial mutation load were also compared to, and showed high agreement with, measurements made using biochemical techniques. The development of image based single cell analysis will continue to be in focus in the ongoing ENLIGHT project. See also Figure 9.
Figure 9:
Result of cytoplasmic segmentation not making use of the cytoplasmic stain (left). Result when cytoplasmic stain is included (middle). Result from manual segmentation of the cytoplasm (right).
|
|
- Quantification and localization of colocalization
Milan Gavrilovic and Carolina Wählby
Period: 0611-
Funding: EU-Strep project ENLIGHT
Abstract:
In fluorescence microscopy, during acquisition of multiply
labeled specimen, two
or more of the emission signals can often be physically located in the same area
or very near to one another in the final image due to their close
proximity within
the microscopic structure. This effect is known as colocalization. Since red and
green wavelengths are usually selected, if spectral overlap occurs, these two
wavelengths will appear as yellow emission. Existing methods
for quantification and localization of colocalized pixels have been implemented
and compared. At the same time work has been initiated on development of new
methods based on spectral decomposition of reference spectra.
- Analysis of random array data
Carolina Wählby
Funding: Uppsala BioX
Period: 0501-
Abstract: Nilsson et al. are developing new methodism for molecular analyses that
allow analysis at the ultimate level of single bio-molecules through
padlock- and proximity probing coupled to rolling-circle amplification.
Rolling-circle products spontaneously form micron-sized coils (blobs) that
can be immobilized randomly on a glass surface, referred to as a random
blob array. Blobs are identified by hybridization of fluorescence
labelled
tag-oligonucleotides. Therefore, individual detection oligonucleotides act
as biotransistors that convey and amplify the information from the
nanometer-sized probe molecules to observable micron-sized products. In
this project, the goal is to use combinations of fluorescent molecules on
single detection oligonucleotides, as well as repeated staining and
de-staining, in order to create image data that can be analysed for
simultaneus identification of many different types of DNA fragments,
transcripts, and proteins.
The position of the reaction sites of a random blob array are random. In
order to classify the blobs, they are first detected by a combination of
filtering and morphological operations. Methods based on spectral
decomposition are therafter used for blob classification.
3D analysis and visualization
- Improved interactive medical image analysis through haptic display
methods
Erik Vidholm, Ewert Bengtsson, Ingela Nyström, Stefan Seipel, Filip Malmberg
Funding: Swedish Research Council, UU TN Faculty
Period: 0301-
Partners: Lennart Thurfjell, GE Healthcare, Uppsala/London, UK;
Gunnar Jansson, Dept. of Psychology, UU; Hans Frimmel, Dept. of Oncology,
Radiology, and Clinical Immunology, UU
Abstract: Modern medical imaging techniques provide 3D images of
increasing complexity. Better ways of exploring these images for diagnostic
and treatment planning purposes are needed. Combined stereoscopic and haptic
display of the images form a powerful platform for such image analysis.
In order to work with specific patient cases, it is necessary to be able
to work directly with the medical image volume and to generate the relevant
3D structures directly as they are needed for the visualization. Most work
so far on haptic display has used predefined object surface models.
In this project, we are creating the tools necessary
for effective interactive exploration of complex medical image volumes
for diagnostic or treatment planning purposes through combined use of
haptic and 3D stereoscopic display techniques. The developed
methods are tested on real medical application data.
Our current applications are interactive liver segmentation from CT images,
see Project 19, accelerating the computation of 3D
gradient vector flow fields, see Project 22, and
hardware assisted visualization of breast MR images, see
Project 20. In additon to this, we are
working on haptic interaction with 3D deformable surface meshes and
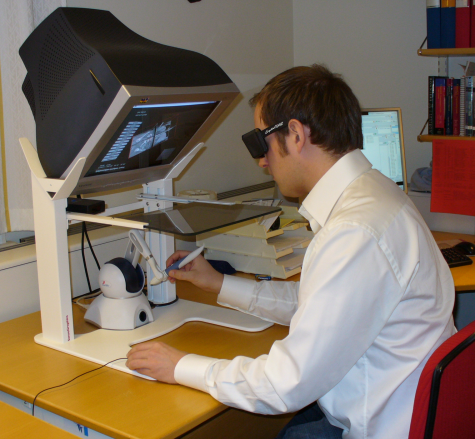
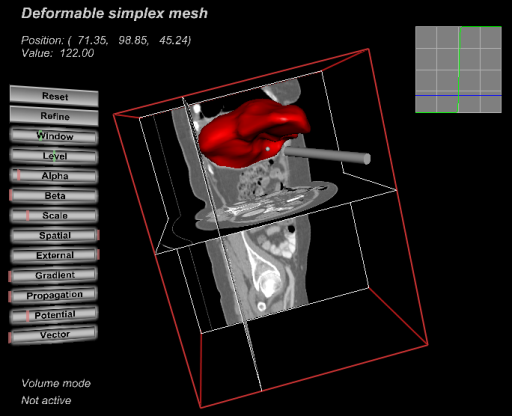
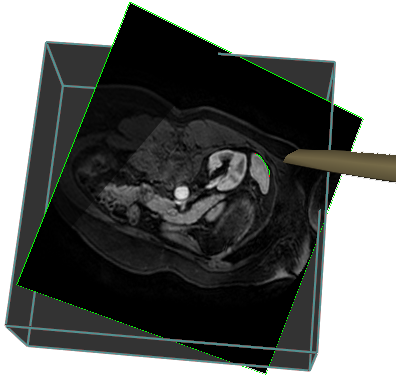
3D Live wire from a more theoretical point of view.
Figure 10:
A user working with the haptic display (left). A screenshot from the deformable model application (middle). A screenshot from the 3D live-wire application (right).
|
|
- Interactive liver segmentation from CT images
Erik Vidholm, Ingela Nyström, Ewert Bengtsson
Funding: Swedish Research Council, UU TN Faculty
Period: 0501-
Partners:
Sven Nilsson, Hans Frimmel, Dept. of Oncology, Radiology, and Clinical
Immunology, UU
Abstract:
The manual step in semi-automatic segmentation of medical volume images
typically involves initialization procedures, such as placement of
seed-points or positioning of surface models inside the object to be
segmented. The initialization is then used as input to an automatic
segmentation algorithm. We investigate how such initialization tasks can
be facilitated by using haptic feedback.
In this project, we develop interactive methods for segmenting the liver
from CT scans of patients with neuroendocrine tumors. Liver segmentation is
of importance in hepatic surgery planning, where it is a first step in the
process of finding vessels and tumours, and the classification
of liver segments. Liver segmentation may also be useful for monitoring
patients with liver metastases, where disease progress is correlated to
enlargement of the liver.
We have used the fast marching algorithm, where haptics is used to make the
initialization of the algorithm easier and more efficient. Two users
placed initializations in 52 datasets (26 patients at two different occasions)
using the haptic user interface. The mean interaction time is about
45 seconds per dataset and the resulting segmentations highly
correlate between the users, i.e., the method has high precision.
The results from this project was presented at
Medical Image Computing and Computer Assisted Intervention (MICCAI'06) in
October. The next step is to verify the accuracy of the method.
- Analysis of dynamic breast MRI
Ewert Bengtsson, Erik Vidholm, Ingela Nyström
Funding: UU TN Faculty, The Australian Research Council
Period: 0503-
Partners:
Stuart Crozier, Andrew Mehnert and co-workers at ITEE department,
University of Queensland, Brisbane, Australia; Ivo Hanak, Dept. of Computer
Science, University of West Bohemia, Czech Republic
Abstract:
The pattern of change of signal intensity over time in contrast enhanced
magnetic resonance (MR) images of the breast is a useful indicator of
malignancy. The methods used for assesing and visualizing this in current
clinical practice are rather tedious; it is difficult to visualise and
evaluate 4D (3D volumes over time) data effectively. In this project,
we are developing and evaluating improved methods for such visualization
and evaluation. The project started during Bengtsson's sabbatical at the
University of Queensland in 2004-2005 and continued as a joint project
after his return to CBA. In September 2006, Erik Vidholm was
visiting Andrew Mehnert at the department in Brisbane.
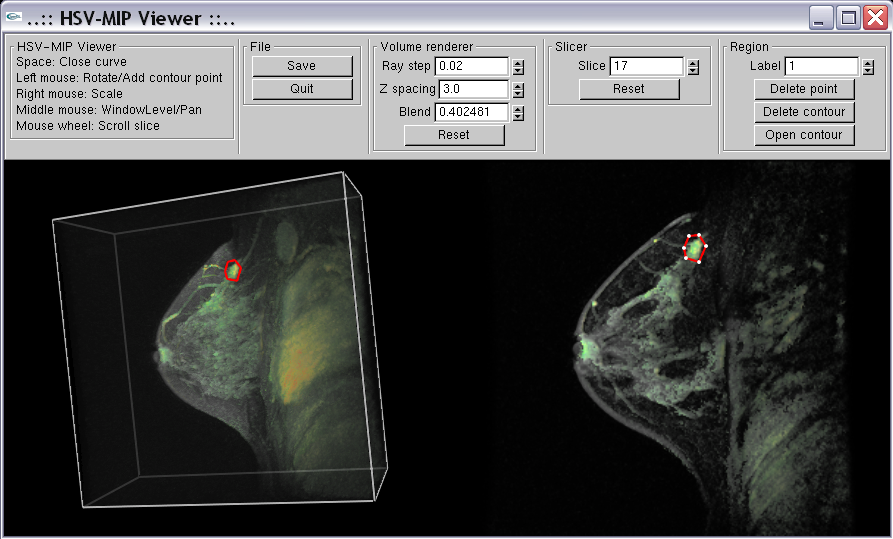
During 2006, we have developed a program where the 4D dataset is visualized
with hardware accelerated maximum intensity projection (MIP) in the
hue-saturation-value (HSV) colour
space. The program also allows for drawing regions of interest.
Figure 11:
Screenshot from the visualization program. The
uptake of MR contrast medium over time in each voxel of the breast volume
images is converted to a colour coded MIP (left viewport), which can be
rotated and explored dynamically giving a direct overview of points of
interest, where there is a potential small malignant lesion. It is also
possible to browse the slices of the color volume and to draw contours
defining regions of interest (right viewport).
|
|
- Interactive exploration of medical images for visualization on standard PC hardware
Suthakar Somaskandan, Ingela Nyström, Ewert Bengtsson
Funding: SIDA
Period: 0409-
Abstract: Several of the modern imaging systems provide 3D volume information, e.g., CT, MRT, SPECT, and ultrasound. This is very useful since the human body is 3D. However, to reach a diagnostic conclusion, the 3D images need to be projected onto the 2D computer screens in more sophisticated ways than slice by slice projections.
It is particularly useful to device methods where the user interactively can explore the 3D information in the images. Earlier, allowing dynamic interaction with medical volume images of realistic, clinically useful resolution required very expensive display stations driven by high-performance computers. Today, a PC equipped with a high-end standard graphics card (mass produced for the game market) can be used quite effectively for the purpose of medical visualization. Still much research work is needed to find out the most effective way of using such display facilities for exploring medical data. The research task in this project is to develop such display methods, e.g., by utilizing the programmability of today's graphics cards.
- Accelerating the computation of 3D gradient vector flow (GVF) fields
Erik Vidholm, Ingela Nyström, Ewert Bengtsson
Funding: Swedish Research Council, UU TN Faculty
Period: 0508-
Partner:
Per Sundqvist, Dept. of Information Technology, UU
Abstract:
In our work on interactive 3D segmentation,
see Project 18, we have developed
methods to facilitate initialization of our segmentation algorithms.
One way is to base the haptic interaction on gradient vector flow (GVF) that
propagates edge information from strong boundaries into the center of objects.
This approach allows a user to feel object boundaries while still
being centered inside the object. The GVF field can also be used to drive a
deformable model, and then we get an intuitive connection between the
model and the interaction.
The computation of a GVF field consists mainly of solving a huge
discretized system of elliptical partial differential equations (PDEs).
The convergence rate of the commonly used numerical scheme to
compute GVF does not allow for practical use in 3D applications.
This project aims at presenting alternative computation schemes to speed up
the computation. The discrete equations have several properties
that can be utilized to accelerate the process of finding an
approximate solution. We investigate how stationary iterative methods,
preconditioned conjugate gradient methods, and multigrid methods
can be tuned to solve our problem.
Our results show that it is possible to obtain much better performance
by only small modifications of the original scheme. The results also
show that the multigrid algorithm is the fastest and allows us to compute
the GVF field in the order of one minute for a standard medical image on a
standard computer (compared to approximately one hour with the commonly
used approach). The results were presented at the International Conference on
Pattern Recognition (ICPR'06) in August.
- Efficient algorithms for computer graphics
Ewert Bengtsson
Funding: UU TN Faculty
Period: 9911-
Partners: Anders Hast, Dept. of Mathematics, Natural Sciences, and
Computing, University College of Gävle; Tony Barrera, Barrera Kristiansen AB, Uppsala
Abstract:
Computer graphics is increasingly being used to create ealistic images of 3D objects. Typical applications are in entertainment (animated films, games), commerce (showing 3D images of products on the web which can be manipulated and rotated), industrial design, and medicine. For the images to look realistic high quality shading and surface texture and topology rendering is necessary. Many fundamental algorithms in this field were developed already in the early seventies. The algorithms that produce the best results are computationally quite demanding (e.g., Phong shading) while other produce less satisfactory results (e.g., Gouraud shading). In order to make full 3D animation on standard computers feasible, high efficiency is necessary. We are in this project re-examining those algorithms and are finding new mathematical ways of simplifying the expressions and increasing the implementation speeds without sacrificing image quality.
The project is carried out in close collaboration with Tony Barrera. It has been running since 1999 and resulted in 2004 in a PhD thesis by Anders Hast. By that time it had produced 20 international publications. Since then another book chapter and a few reviewed conference papers have been produced.
- Real-time rendering of ice
Stefan Seipel
Funding: UU TN Faculty
Period: 0603-0608
Comment: Anders Nivfors (MSc student) is a cooperation partner.
Abstract:
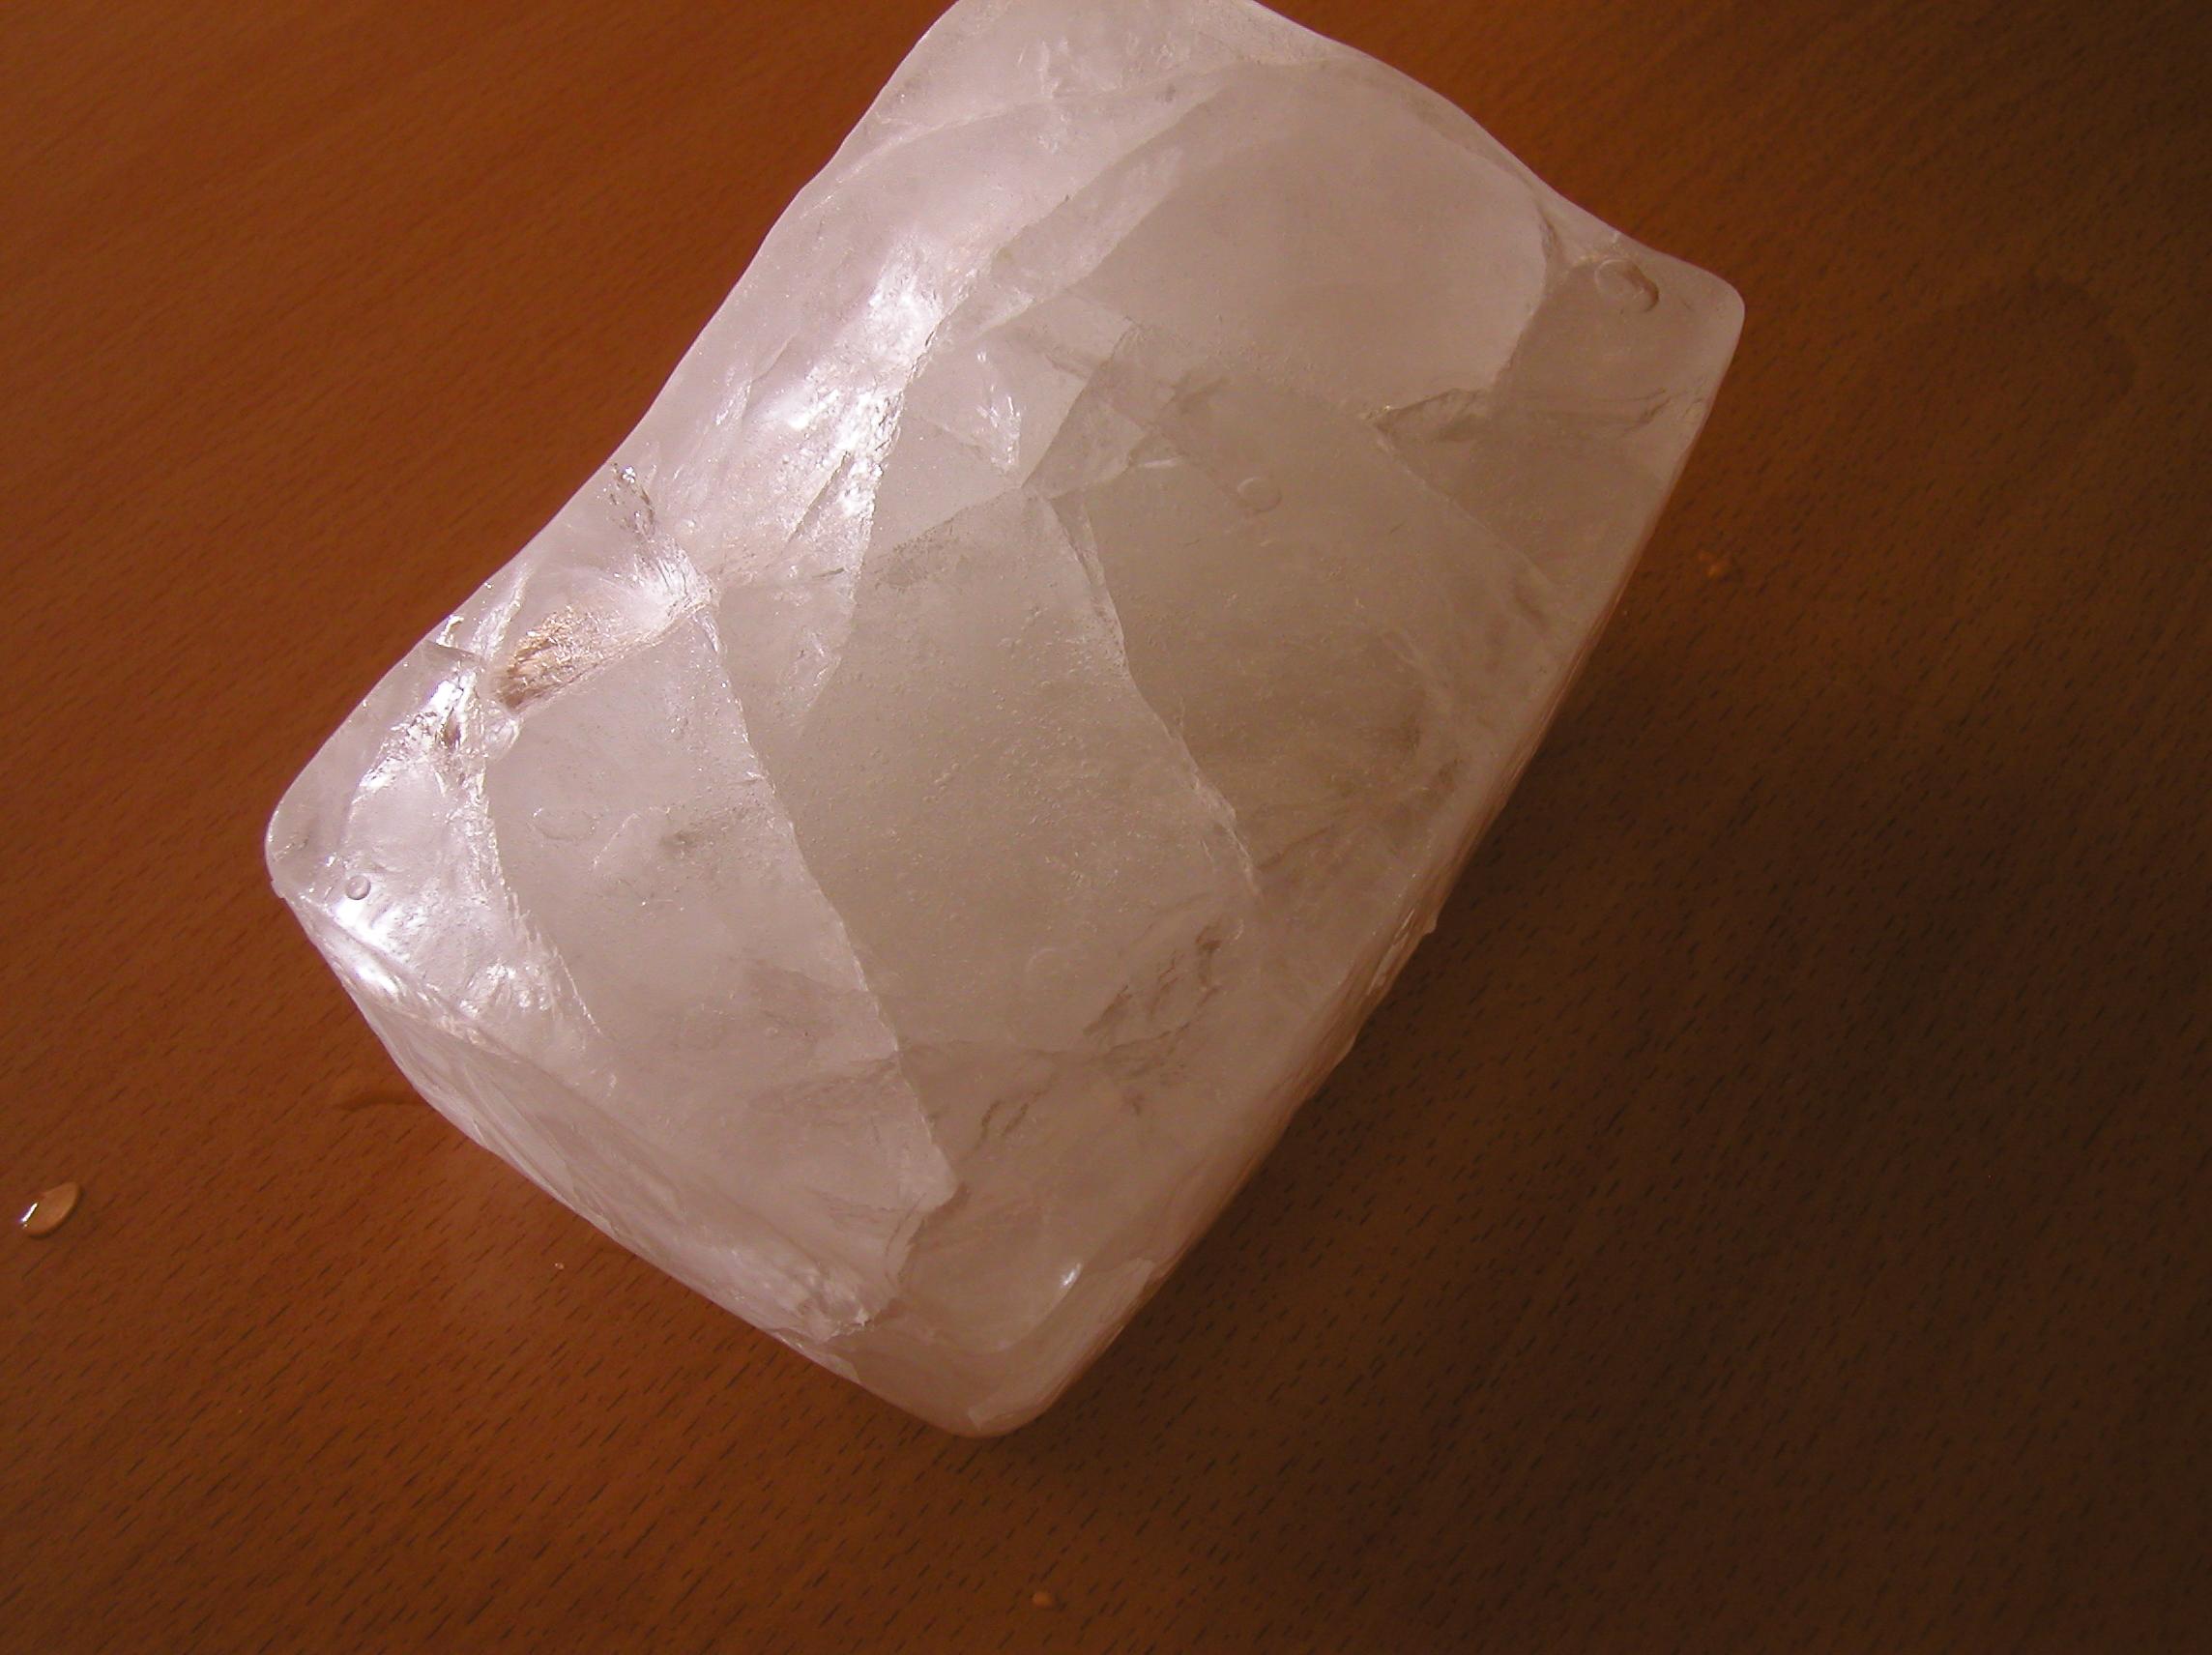
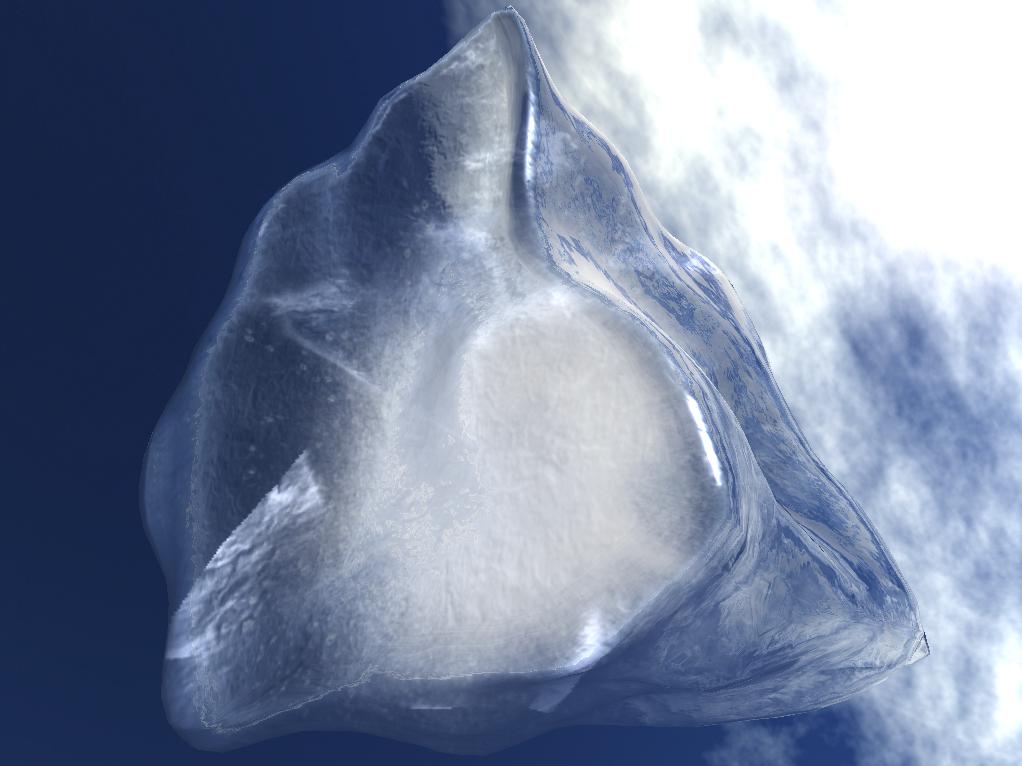
Ice is a common phenomenon in nature and occurs in our everyday surroundings in form of e.g. icicles and ice cubes. The rendering of ice is, however, a field of real-time computer graphics that has not been subject to exhaustive research. Realistic rendering of natural phenomena in real-time has always been one of the most difficult tasks. As a result of this there are numerous papers describing techniques to implement fire, smoke, clouds, fog, water etc, but ice seems to be all ignored. In this project we identify the most eye catching characteristics of ice and what distinguishes ice from similar materials such as glass. The main focus of the project is to develop a method for rendering ice and its most important characteristics in real-time using the functionalities of the GPU on modern graphics cards. The methods developed are capable of filling a given convex geometry with air particles and bubbles as well as adding an arbitrary amount of cracks. They comprise the creation of a bumpy and irregular surface that reflects and refracts the environment. An improved image space technique for clipping a geometry using the Boolean difference of two geometries was developed, as well. It is applied to the cracks in order to clip them against the ices geometry. Reflection and refraction effects on the ice were realized by using environment mapping. An improved method for two-sided refraction was developed that combines the normals of the front and back side of the ice object. See Figure 12.
Figure 12:
A real ice block frozen in a refrigerator (left). A synthetically rendered ice-cube (right).
|
|
- Visualization of multivariate 3D volume data
Stefan Seipel
Funding: UU TN Faculty
Period: 0606-0612
Comment: Cezary Bloch (MSc student) is a cooperation partner.
Abstract:
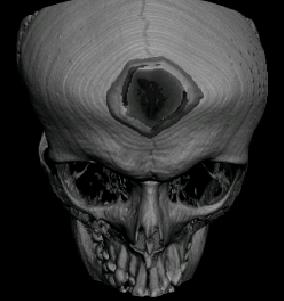
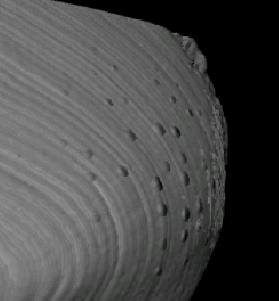
In this project we aimed at developing new methods to directly render multivariate volume data. When rendering 3D scalar fields (e.g. in medicine) on a 2D computer screen, the means for expressing various attributes in every voxel are usually limited to colors, only. Graphically more complex annotations or glyphs require a too large footprint on-screen and hamper perception of the spatial structure of the underlying data. In this project we looked at new methods direct visualization of more than one scalar value, excluding color manipulations. The general objective was to investigate if a secondary variable could be visualized by modulating the illumination functions in 3D rendering, or by using modulated textures to express the secondary attribute. As a result of this experimental project, we came up with a new method that utilizes 3D normal mapping. A 3D normal map is used in the 3D shading model of the volume renderer to create volumetric bumps. The appearance of bumps is modulated with respect to the values of the additional scalar attribute. See Figure 13.
- Collaborative 3D visualizations
Stefan Seipel, Lars W. Pettersson
Funding: UU TN Faculty
Period: 0309-0612
Partners: Swedish Defense College; Dept. of Information Technology, UU; University College of Gävle
Abstract:
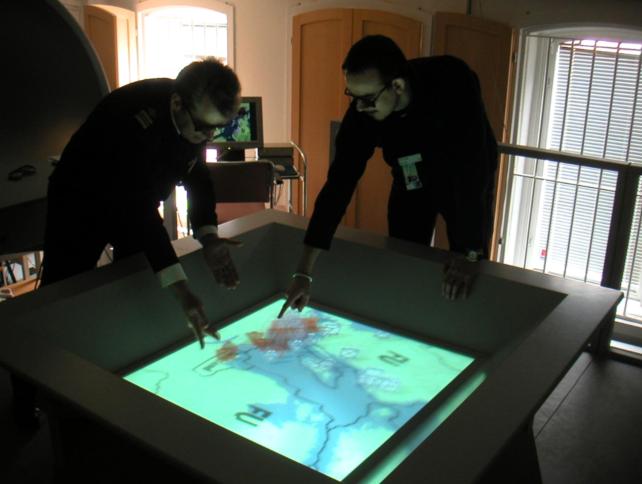
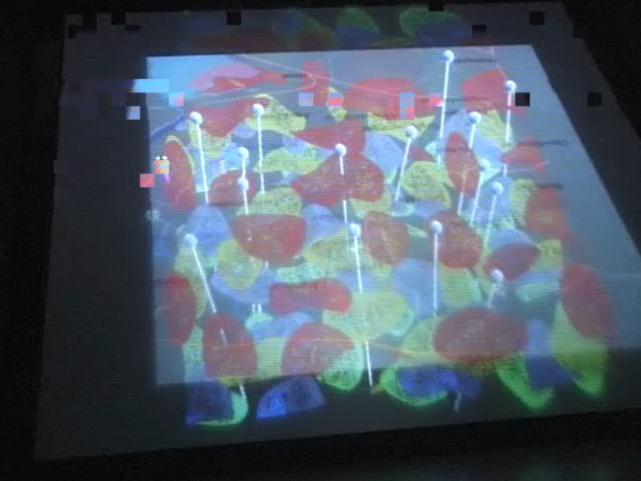
In many important decision situations, more than only one stakeholder is concerned with the analysis and interpretation of the decisive data. Often, the data collected is very complex, it may be organized in several orthogonal dimensions or is ordered in multiple independent layers. Our technical means to efficiently visualize this complexity are limited to the two-dimensional grid of colored pixels on a computer screen. In this current project we investigate how we optimally can design visualizations that support more collaborating users who interact simultaneously with the same visualization in the same place. We use a rather unique display technology (in collaboration with and at the Swedish Defense College - FHS) to present up to 8 individual pictures at the same display surface. It allows to selectively controlling, which picture(s) are seen by individual users. In this environment we study the effects of several features of advanced visualizations, which are dynamic observer conditions, stereoscopic cues, and layer separated visualizations. See Figure 14.
Figure 13:
Direct volume rendering of a skull with volumetric bumps at the left forehead modulated by a secondary attribute in the dataset.
|
|
Figure 14:
The AQUA display environment at FHS is our test bed (left). A layer-partitioned visualization in GIS applications (right).
|
|
Forestry related applications
- Image analysis of the internal structure of paper and cellulose based composite materials in 3D images
Maria Axelsson, Filip Malmberg, Stina Svensson, Joakim Lindblad, Gunilla Borgefors
Funding: SLU S Faculty
Period: 0406-
Partners: Norwegian Pulp and Paper Research Institute (PFI),
Trondheim, Norway; STFI-Packforsk, Stockholm; KTH Solid Mechanics, Stockholm; StoraEnso, Falun
Abstract:
The internal structure of paper is important to study since
many material properties correspond directly to the properties of
single fibres and their interaction in the fibre network. How single
fibres in paper bond and how this effects paper quality is not fully
understood since most structure analysis of paper has been performed
in cross sectional two dimensional (2D) images and paper is a complex
three dimensional (3D) structure. Another application for wood-fibres
that has recently gained a lot of interest is wood polymer composite
materials. The properties of these materials do not only depend on the
structure of the fibre network, but also on interaction between the
fibres and the polymer matrix surrounding the fibres. Advances in
imaging technology has made it possible to acquire 3D images of paper
and wood polymer composite materials. In this project, image analysis
methods for characterising the 3D material structure in such images
are developed. The detailed knowledge of the material structure
attainable with these methods is useful for improving material
properties and for developing new materials.
An example slice from a binarised volume and a surface
rendering of a sample of a composite material image with X-ray
microtomography are shown in Figure 15.
The project objective is to achieve a complete segmentation of
individual fibres and pores in volume images of the material. Given
such a segmentation, any measurement of the internal structure is
available. Measurements on individual fibres and the structural
arrangement of fibres can then be related to macroscopical material
properties. Other methods for measuring properties of the material,
that do not require a complete segmentation of the samples, are also
investigated.
In this project, different volume images of paper and composite
materials are available for the studies. This includes one volume
created from a series of 2D scanning electron microscopy (SEM) images
at StoraEnso in Falun and X-ray microtomography volume images of paper
and composite samples imaged at the European Radiation Synchrotron
Facility (ESRF) in Grenoble, France. Furthermore, methods for creating
other sample volume images are investigated.
During 2006, the project has resulted in a number of publications. A
method for reducing ring artifacts in the volume images using
orientation estimates and normalised convolution in the polar domain
was presented at the DAGM conference in September 2006 and published
in the Lecture Notes in Computer Science Series. See
Figure 16 for an illustration of the method. At the
Progress in Paper Physics Seminar three extended abstracts were
presented. One abstract on 3D structure characterisation of newsprints,
one on stress transfer and failure in pulp fibre reinforced composite
materials and one on damage mechanisms in paper.
Figure 15:
A slice from a binarised volume image of a composite
material (left). A surface rendering of a sample of a composite
material (right).
|
|
- Estimation of the water holding capacity of press felts
Maria Axelsson, Stina Svensson, Gunilla Borgefors
Funding: SLU S Faculty
Period: 0501-
Partners: STFI-Packforsk, Stockholm
Abstract: Press felts are used in the manufacturing of paper to press
water from the wet fibre web after the sheet formation in a number of
press nips. The press felt surface is a non uniform porous
structure. The amount of water that can be pressed out of the fibre
web and the amount of the water that is transfered back to the fibre
web in the separation rewetting depends on the structure of the press
felt surface.
In this project the amount of water that can be held in the interface
pores between the press felt surface and the fibre web is
estimated. Samples of press felts were compressed to different degrees
against a glass plate and imaged in a Confocal Laser Scanning
Microscope. A method for calculating the size of the interface pores
by estimating the fibre web depression into the felt structure was
developed. The method was published in Nordic Pulp and Paper Research
Journal in 2006. And the method was also presented at SSBA 2006. For
an example of 3D renderings of a press felt surface under load, see
Figure 17.
Figure 16:
A slice from an X-ray microtomography image showing a
ring artifact (left). Reduction of the ring
artifact (right).
|
|
Figure 17:
The surface of the press felt observed through a Confocal
Laser Scanning Microscope. Load of 1 MPa (left). Load of 10
MPa (right).
|
|
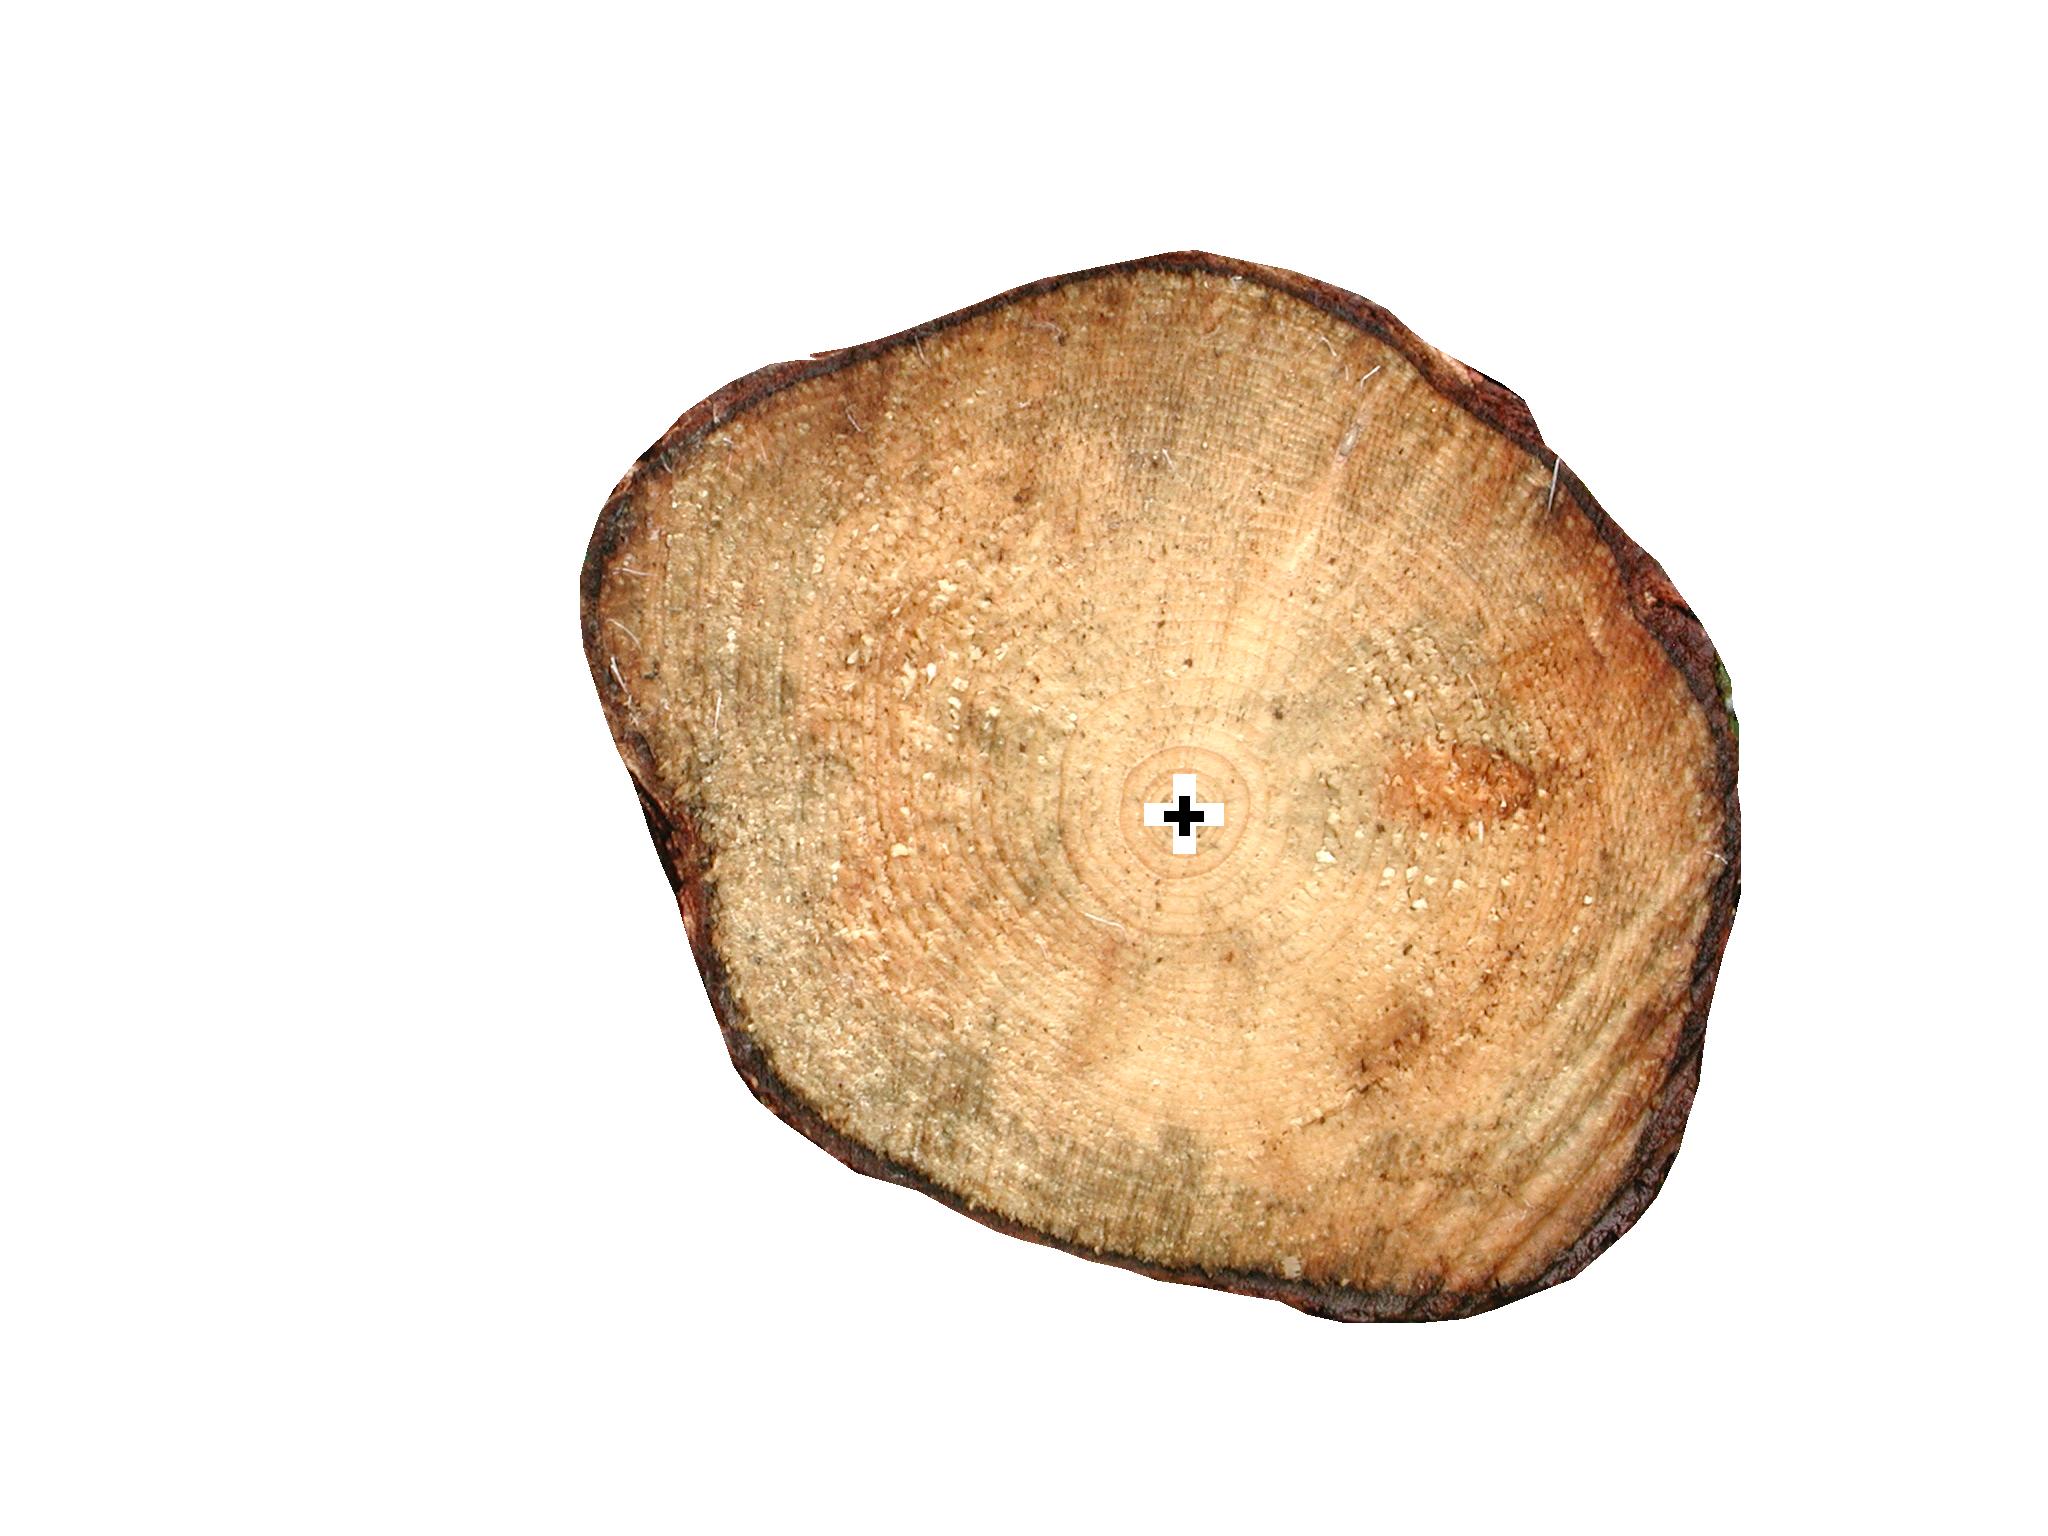
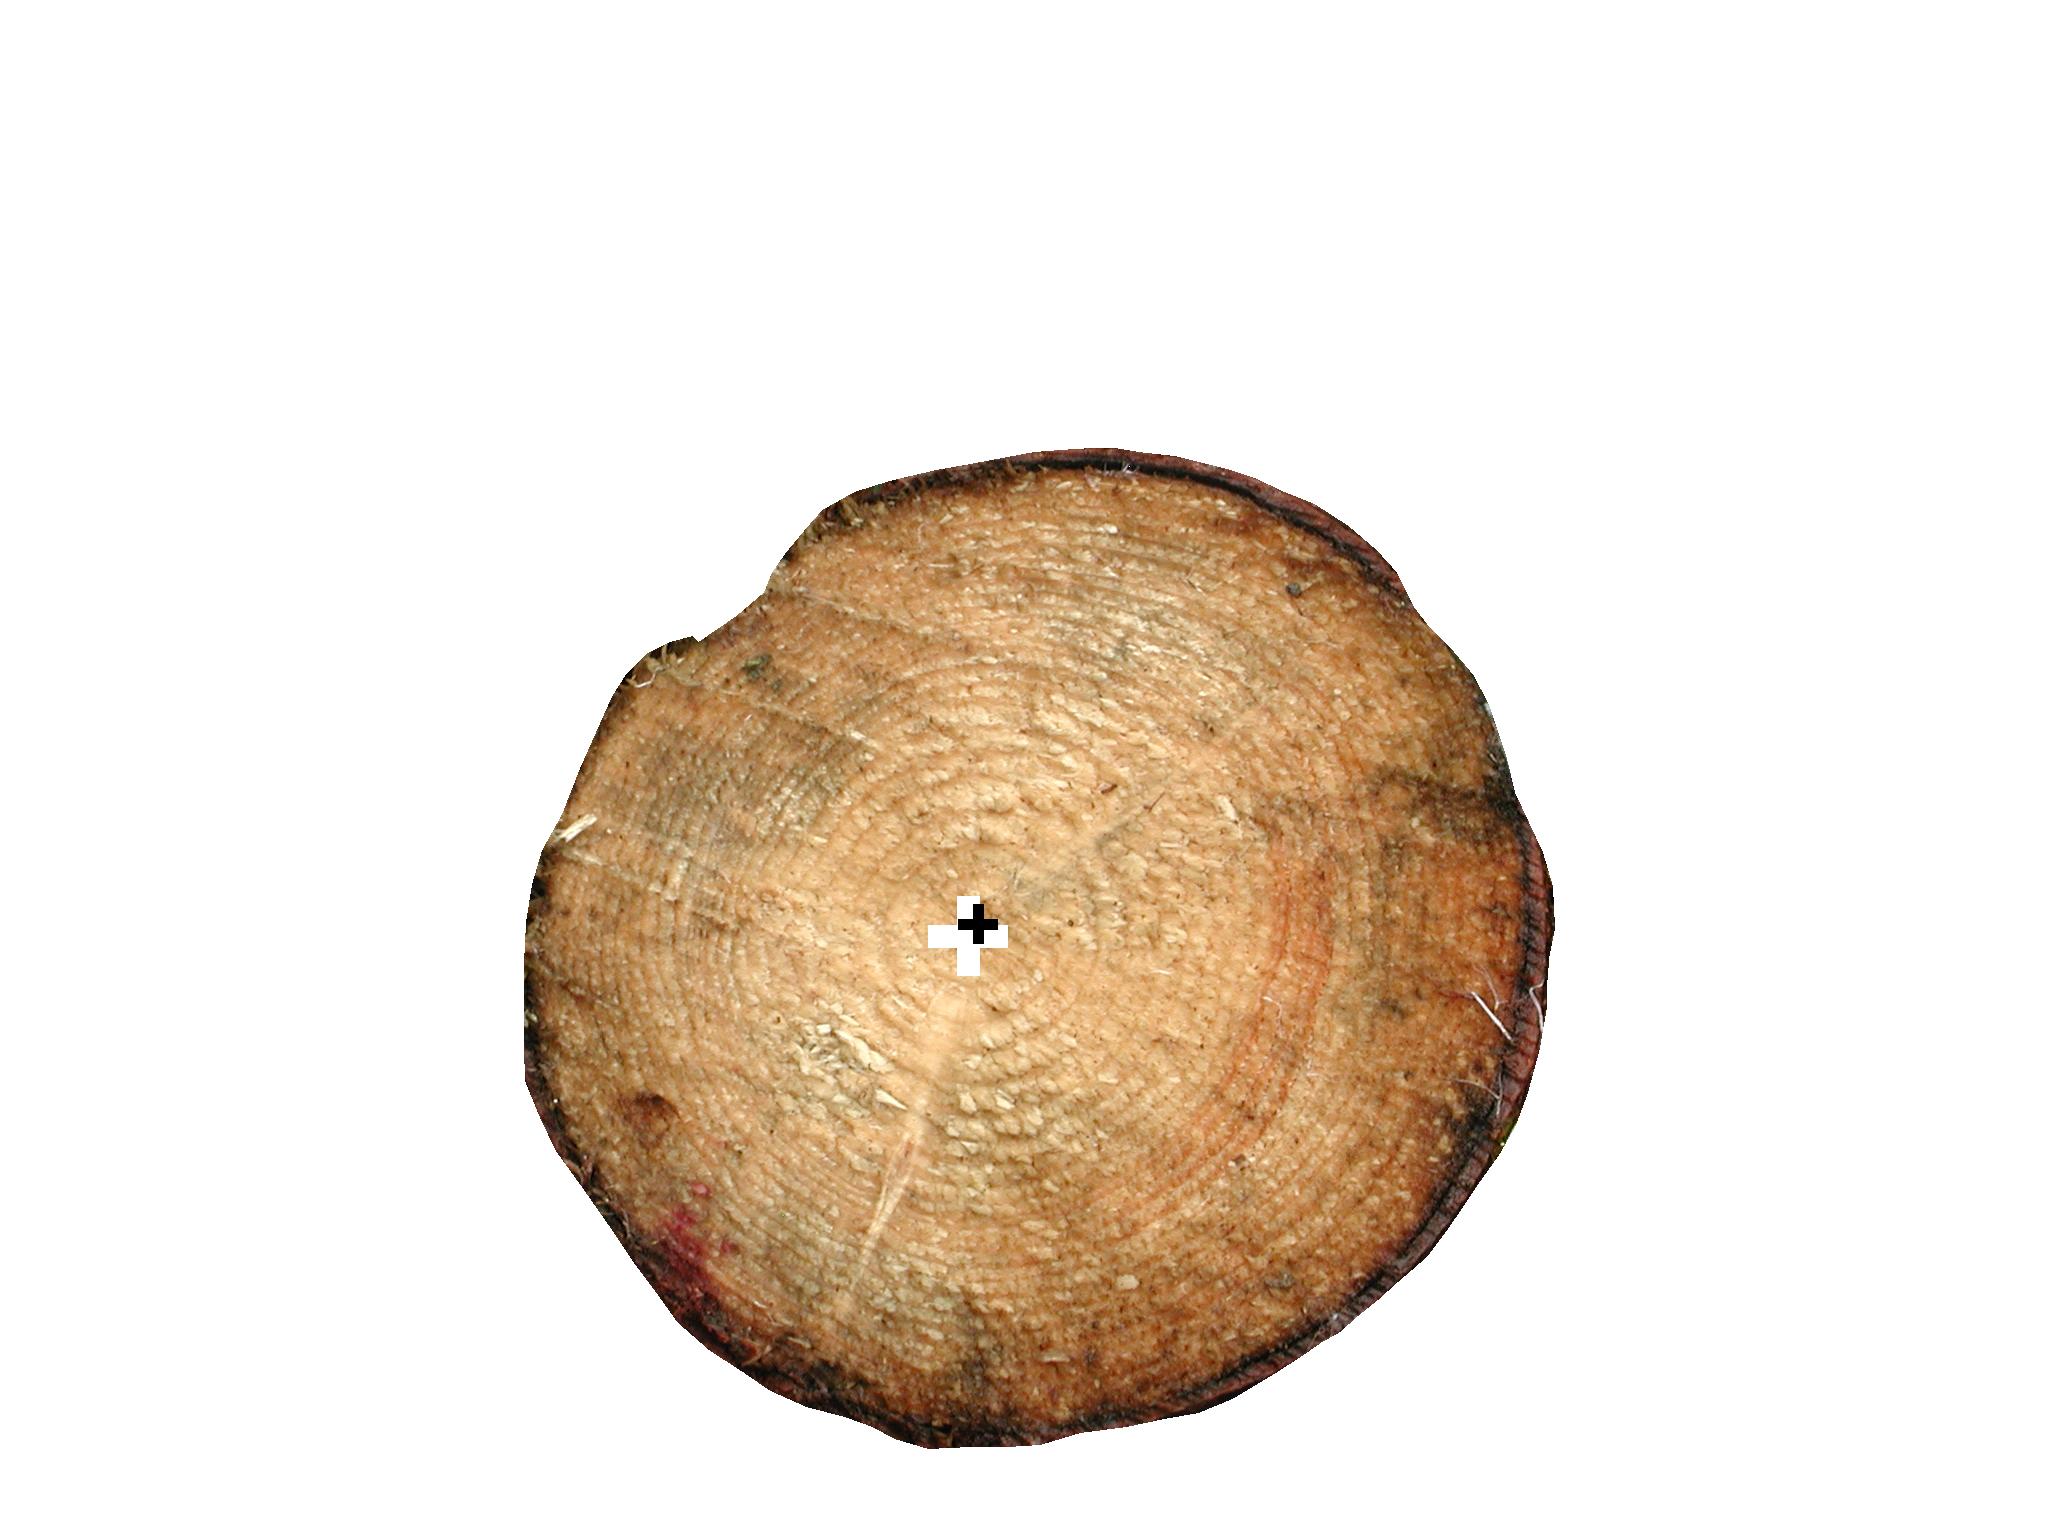
- Log end feature extraction of untreated wood logs in saw mill environment
Kristin Norell, Stina Svensson, Gunilla Borgefors
Funding: The Swedish Timber Measurement Council (VMR), SLU S Faculty
Period: 0505-
Partners: The Swedish Timber Measurement Council (VMR), Dept. of Forest Products and Markets, SLU
Abstract:
The wood quality of a log can be analyzed to some extent by examining the log end. Such analysis is mostly performed manually at saw mills, where the log scaler has a couple of seconds to determine features like the approximate annual ring density, presence of rot and precense of compression wood. By using an image analysis application instead, the analysis can be more robust. In this project methods to measure important properties of logs in saw mill environment using computerized image analysis is developed. Some interesting features are:
- position of the center of the annual rings (pith)
- shape of the log end
- annual ring density
- rot
- blue stain
The images used are log end images of norway spruce and scots pine taken in a saw mill environment. The logs are sawn with a regular harvester or chain saw. Images used so far are picked to represent a large variety of features that can occur.
Pith position is found using filters to detect local orientation, Hough transform, and a final adjustment technique. Once the pith is found some other measurements will be easy, and others will be facilitated. Figure 18 shows two typical log end images. The result of the pith detection and the ground truth are marked with a white and a black +-sign, respectively. During 2006 the pith detection method has been presented at the Swedish Society for Automated Image Analysis Symposium and also submitted to a journal. Work has also been started on the detection of annual rings.
Figure 18:
Typical log end images showing norway spruce. The result of the pith position detection is seen as a white +-sign and the ground truth as a black +-sign.
|
|
- Detection of rot in end faces of wood logs
Kristin Norell, Stina Svensson
Funding: SLU S Faculty
Period: 0612-
Partners: Kim Dralle, Anders Björholm Dahl at Dralle A/S Cognitive Systems, Copenhagen, Denmark
Abstract: This project focuses on image analysis methods for identifying rot in log end faces. The purpose is to detect rot already while harvesting, or when the logs are in a stack waiting for transport. Logs are depicted using a standard color digital camera that can be mounted on a harvester or a vehicle. The goal is to find a robust method for detecting rot in timber suitable for practical use.
- Image analysis for quantitative estimation of seed vitality
Joakim Lindblad, Gunilla Borgefors
Funding: The Swedish Farmers' Foundation for Agricultural Research (SLF)
Period: 0509-0603
Partners:
AnalyCen Nordic AB, Lidköping; SeedGard AB (prev. Acanova), Uppsala; Anders Larsolle, Dept. of Biometry and Engineering, SLU, Uppsala
Abstract:
ThermoSeed cereal seed treatment is a new method for thermal seed treatment
developed by SeedGard AB (prev. Acanova). The method makes it possible to
produce seed free from seed-borne pathogens without using chemical seed
dressing. By exposing seeds for precisely conditioned hot humid air, pathogens
are rendered harmless without affecting seed germinability.
It is of interest to facilitate objective and accurate monitoring of how
different treatments and different types of stress affects the vitality of
seeds. During the autumn of 2005 computer software for automatic
segmentation and separation of individual plants as well as to measure
relevant parameters, such as area and length, of the plants were developed.
In early 2006, the software was delivered to SeedGard AB, where further
testing and tuning of parameters followed.
Remote sensing
- Nordkalotten Satellite Evaluation co-operation Network (NorSEN)
Tommy Lindell
Funding: UU TN Faculty, Dept. of Infrastructure, KTH, Stockholm
Period: 0406-
Partners: Kai Sörensen, Norwegian Institute for Water Research
(NIVA); Terry Callaghan, Abisko Scientific Research Station (ANS), Fredrik Bergholm
Abstract:
Field measurements were performed on Lake Torneträsk, and near Abisko. From
June 2004, spectrometer measurements were run by Fredrik Bergholm on the arctic
vegetation around Abisko Naturvetenskapliga Station (ANS), and spectral
measurements were performed by Tommy Lindell and Kai Sörensen on Lake
Torneträsk. The field measurements have continued during the following years
2005 and 2006. Fredrik Bergholm has been measuring with spectrometers, among
other things from the ski lift in Abisko. Tommy Lindell and Kai Sörensen has
been taking water samples for analyses, made manual recording of spectral
characteristics and have had a floating device on Torne Träsk for spectral
measurements during the summer months. Tommy Lindell has collected and analysed
satellite data from the lake. Kai Sörensen has been using ships on Hurigrutten
for continuous sampling of spectral information and water quality variables.
These field measurements have contributed to the data base for the Scandinavian
NorSEN project, which formally started in 2005. The project deals with
validation of satellite images in polar-near areas, and build-up of ground-
based spectral sensors around ANS. Little scientific work has been done before
on the use of satellite data in polar-near areas, with low sun angles and
special atmospheric conditions. The project aims to find normalisation and
correction measures of the satellite data for these areas.
- Digital video and colour camera in remote sensing of water
Tommy Lindell
Period: 0001-
Partners: CNR, Milan, Italy
Abstract: Test of the usefulness of air-borne digital camera and video for mapping water variables. Lindell has been constructing a holder for the digital video/camera for small aircrafts. Data have been collected from Lakes Erken and Mälaren, and from coral bottoms in Bisceyne National Park. Recently, tests of the usefulness of those images have been performed for the classification of the Swedish coastline. The system has been further used for the classification of the Swedish coastline.
![\includegraphics[width=0.35\textwidth bb=196 321 411 529, clip]{./Images/optimal_fcc.pdf}](fccbcc.PNG)
![\includegraphics[width=0.18\linewidth bb=0 0 51 44, clip]{./Images/bone_z25.pdf}](defuzz.PNG)
![\includegraphics[width=0.35\textwidth bb=0 -60 513 513, clip]{./Images/binary.pdf}](composite.PNG)

![\includegraphics[width=0.49\textwidth bb=113 282 505 516, clip]{./Images/felt_surface_2_2_2_projbesk.pdf}](confocal.PNG)