
|
|
|
|
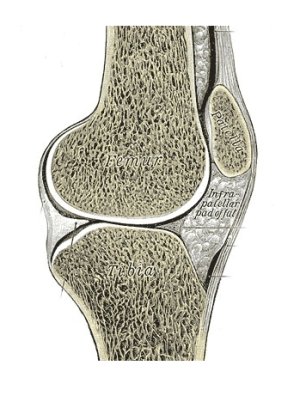
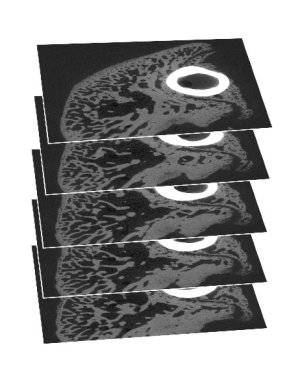
Assessing bone implant integration from synchrotron micro-CT dataThe growing age of the population, with, for example, bone-associated problems will increase the demand for spare parts, that is, bone-anchored implants. These spare parts, biomaterials, are referred to as devices. Since a device is not a drug, it does not have to undergo the same intensive research and pre-clinical tests before implantation in patients as drugs. And almost all tests in humans are done on healthy young men, whereas implants are most often given to older women suffering from osteoporosis. Much in still poorly understood regarding implant integration.This project is a part of a larger, on-going project that aims at improving the quantitative and qualitative analysis methods in order to support the development of effective implants and to diminish the number of malfunctioning devices. To do this we use novel volume imaging techniques combined with pioneering automatic quantitative image analysis measurements. But we, and our co-operation partners - would like to also be able to see our data. In fact, to facilitate good communication between the people involved - material scientists, medical doctors, and computer scientists - each with their own special knowledge, it is of highest importance to provide a common visual platform for a mutual understanding of the problems of implant integration. Our current project aim is to improve the understanding of the mechanisms of implant integration by developing 3D quantitative and absolute measures to describe the regrowth of bone around implants. This will provide means for judging the strength of the implant integration. However, we also need to visualise the data in a useful way. And commercial visualisation software is useless for this type of data, because of the complexity of the bone structure. Until very recently, implants were only evaluated from 2D microscopic images. There are several reasons for this. One is that the bone structure is so fine that we need high resolution computer tomography (CT) images to see the so called trabecular structure of the bone that interacts with the implant, see Fig. 1. Another is that the density difference between the metal implant and the bone is so high that standard micro-CT devices are useless, as the metal shadows the area close to it. The area where we are, in fact, most interested to measure the bone. The only way to create useful 3D images so far is to use synchrotron radiation based micro CT (SRuCT), which is to travel to the few places in Europe where such synchrotrons exist, to get a few hours beam-line time to take a few pictures. We have access to some such pioneering data, see an example of a few slices through an image volume with a metal screw integrated in a rat tibia in Fig. 2. Because we now have these data, we can, for the first time, develop and automatically compute 3D measures of bone integration, see references. But although the images in Fig. 2 are adequate for quantitative measures, they are very difficult to interpret visually. From a stack of these slices it is difficult to see what is going on, qualitatively. But this understanding is very important for medical and material scientists.
Today, implant integration is usually measured by two relative area measures and one relative length measure in 2D microscopy images of one ground slice through each implant. This reveals information about only a small portion of the sample and the variance of that information is high. This is because the bone structure is very variable, so the integration can look either good or bad for the same sample, depending on where the cut happens to be done. Therefore, we need measures of the integration of the whole implant, that is, measures in 3D. But which measures to compute? Being able to actually see the 3D structure around the implant for the first time will no doubt inspire new measures of the implant integration quality. SRuCT measures density. It is of interest to extract new information from the image intensities, since density variations may indicate differences in the bone quality surrounding the implant, something that has not been measures before. These density variations should be distinguishable in the 3D visualisations. This would be novel information to medical and material scientists. Commercially available software for 3D visualization is designed for fairly solid and convex objects, since most objects that people want to visualise look that way. This is, however, not the case for the highly intricate structures of trabecular bone that surrounds bone implants, which is what we wish to assess. Trabecular bone looks like a sponge, with a huge surface-to-volume ratio, see Fig. 1 again. It is obvious that neither Phong shading nor methods based on raytracing will work, as the former is too primitive for our data whereas the latter is too slow for interactive visualisation. Therefore, our approach will be based on ambient occlusion. We have already used simple versions of such methods for visualising wood fibre networks - another high surface-to-volume ratio material - with good results. However, the bone implant images are more difficult, due to the bone structure and that fact that we must distinguish between (at least) solid bone, trabecular bone, soft tissue, and implant. This will need a sophisticated use of colour in the visualisations. Because the main use of the visualisations will be for communication with medical experts, they must be fully interactive, with a wide range of possible instant variations. This leads to considerable demands on the visualisation software. 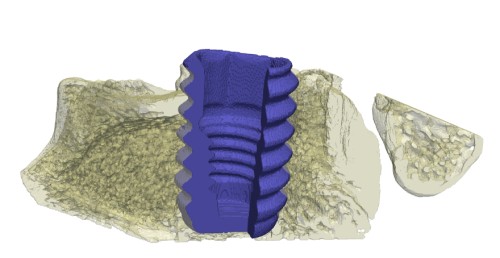 Figure 3. Rendered subvolume of segmented SRuCT 3D image, showing part of the implant (blue) and part of the bone tissue (yellow) We also need 3D SRuCT images of sample bone implants with various, relevant properties to visualise. We have a few, but far from enough, especially since we need to have as large variation as possible in the bone and implant structures to be able to develop adequate visualisation methods. In addition to new implants and new medical condition in the animal studies, new ways of staining the samples will be tested. We will use both fluorescence staining in vivo and histological staining after the implants have been retrieved with surrounding tissue and SRuCT-ed. 2D microscopic images and evaluations of these are necessary to be able to ensure that the new 3D visualisations really do show the relevant structures in the tissue surrounding the implants. If we can not convince the medical profession of this, the visualisations will never be accepted. The participants in the project are: Prof. Gunilla Borgefors, project leader (10% time), Ph.D. student Hamid Sarve (30% time) and his assistant supervisor Dr. Joakim Lindblad (5% time), all at Centre for Image Analysis, SLU, Uppsala. We will develop visualisation methods supported by the leading visualisation knowledge available at CBA Prof. Carina B. Johansson (20% time) at Dept. of Clinical Medicine, Örebro University, will prepare new implant samples and provide knowledge about the implant integration process. Prof. Magnus Jacobsson (10% time) at Astra Tech AB, Mölndal which develops and sells implants. He will work as a consultant in the project and provide expertise on implants and on which novel visualisation methods that will be most useful. The proposed project would be active during two years. Making new samples takes considerable time, so images with new implant and bone properties will not be available for a while. We have enough sample images to start working, though. Sarve, who will spend most time in the project will have his dissertation in two years, and then the project should be finished. References to development of automatic quantification methods for implant integration by the applicants- H. Sarve, J. Lindblad, C. B. Johansson, G. Borgefors, V. F. Stenport: Quantification of Bone Remodelling in the Proximity of Implants, Springer LNCS 4673, pp. 253-260, 2007.- H. Sarve, J. Lindblad, C. B. Johansson: Registration of 2D Histological Images of Bone Implants with 3D SRuCT Volumes, Springer LNCS 5358, p. 1071-1080., 2008 - H. Sarve, J. Lindblad, C. B. Johansson: Quantification of Bone Remodelling in SRuCT Images of Implants, Submitted 2009. |