FNXCT : Software to analyse fibre networks of paper in XCT images
Developed by Erik
Wernersson
Features
- Visualisation and navigation throught XCT images of paper
materials
- Manual selection of fibres
- Automated analysis based on manually selected fibres
Screenshots


Screenshots from version 2013-03-18.
Code
As it is:
Data
One volume is available for download to show how the pre processing is
supposed to be done. The data is property of Innventia.
Documentation
Installation
- This is not tested with the latest matlab versions, i.e, R2014b
and above. Changes to the graphics systems might cause
problems.
- Download and extract the latest version under code above.
- Compile C++ code by running
compileCPPfiles.m, this
requires that you have a compiler installed. We have used GCC
(https://gcc.gnu.org/)
- Prepare a volume (see below)
- start
main.m
- If you get an error message that '
first' does not exist, just
set it to something, i.e., first=10 in MATLAB.
Volume preparation
1. Create a 3D matrix of type uint8 called
V, e.g.:
V = zeros([size(I,1), size(I,2), numberOfImages],
'uint8');
2. Prepare the data so that 0 corresponds to air and that 255 corresponds to fibre so that 128 corresponds to half fibre and half air.
3. Copy the data to V
4. Save V in a .mat file, i.e.,
save('-v7.3','myvolume.mat', 'V')
5. Run main.m and select myvolume.mat
Usage
At the moment, there is no documentation other than this site, the
paper and the code. The program is intended to be used in the
following manner:
- Run
main and select a volume that you have prepared
in the file dialogue (start with the dest data set given above).
- For each fibre, use the first three buttons from top to bottom to
select the fibre.
- Press the 'XY' button, this will show a sum projection of a
region in the image.
- Select the window and resize it as you wish. Then press '2' to go
into slide mode. Press down the left mouse button and drag up and down
to scroll in the image. When you are at a good spot, release the mouse
button.
- Press '1' to go into selection mode. Left click on the image and
a yellow marker will appear. Add a few of these to delineate a fibre.
The markers can be moved around by clicking and dragging them. They
can be removed by clicking them with the right mouse button.
- You might need to switch between selection mode and scroll mode a
few times to select fibres that are not completely planar.
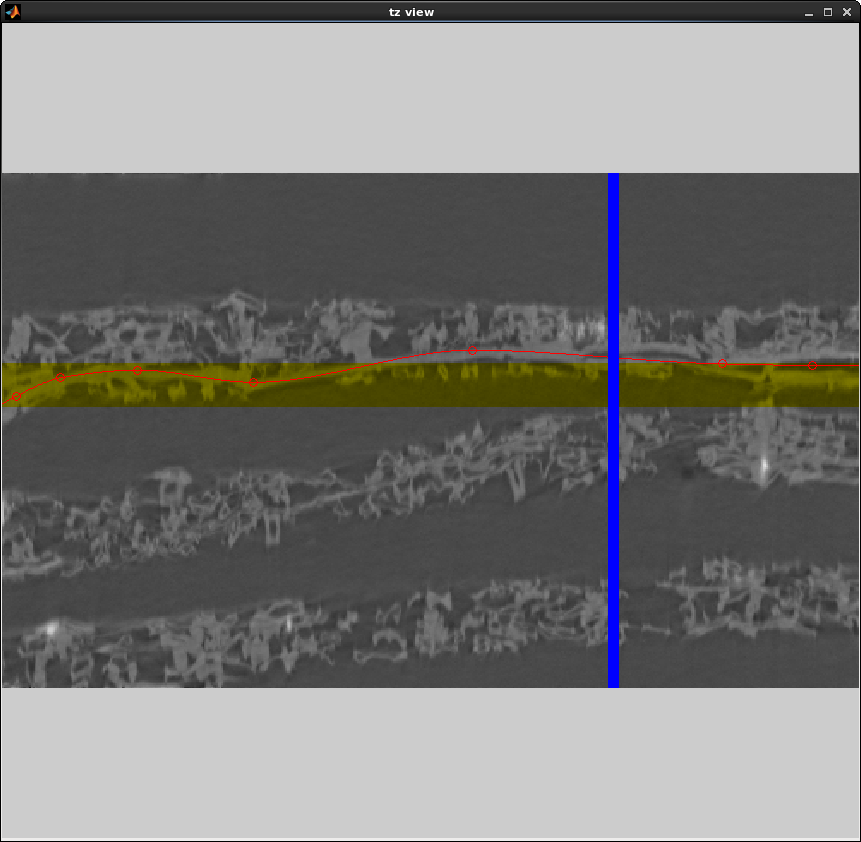
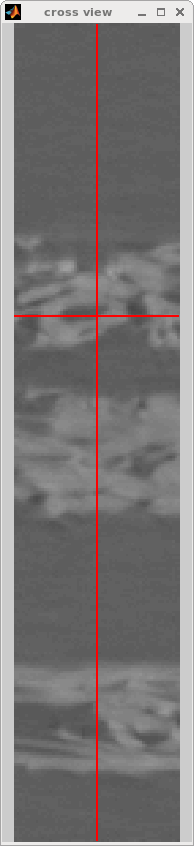
- When satisfied, press the ZT button in the menu. That will bring
up two new windows for delineating in the perpendicular view. At this
point, don't edit the markers in the XY view.
- Edit the markers in the TZ view in the same was as in the XY
view. Use the blue slider to see how the cross sections look (cross
view window).
- When satisfied, press the third button in the menu, 'save'. And
repeat the steps above for another fibre.
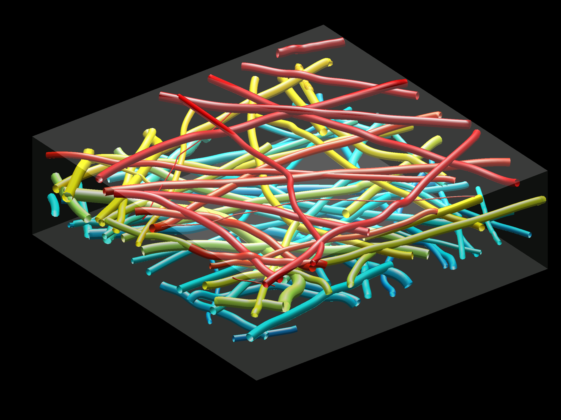
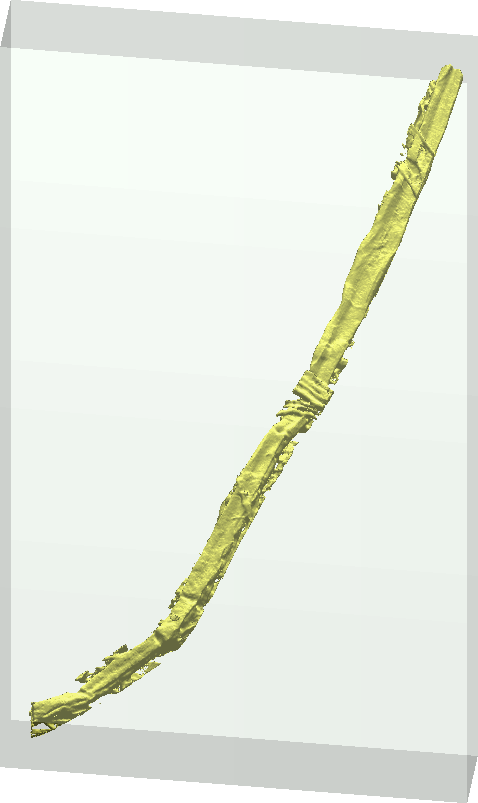
- When you don't want to select more fibres, you can look at them
using the 'show3d' button, and calculate some properties with the
'statistics' button. Note that some parameters need to be tuned
for each sample to adjust for the fibre morphology.