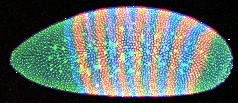
Embryo stained for genes Even Skipped (blue) and Fushi Tarazu (red).
Embryo stained for genes Even Skipped (blue) and Fushi Tarazu (red).
The goal of the BDTNP is to decipher the transcriptional information contained in the extensive cis-acting DNA sequences that direct the patterns of gene expression that underlie animal development. Using the early embryo of the fruit-fly (Drosophila Melanogaster) as a model, we are developing experimental and computational methods to systematically characterize and dissect the complex expression patterns and regulatory interactions already present prior to gastrulation.
One of the parts of this project is to develop methods to image and analyze the expression pattern of genes in 3D at cellular resolution. This has to be done on a high-throughput pipeline so that the pattern for thousands of genes at different stages of embryo development can be characterized and compared. This is the part I'm working on.
NOTE: The text on this page was written in 2006 and hasn't been updated since! See the literature and links below for more up-to-date information on the project.
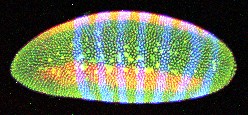
Embryo stained for genes Fushi Tarazu (blue) and Rhomboid (red).
We image embryos of specific ages (throughout stages 4 and 5, as defined by Campos-Ortega and Hartenstein). The embryos have been stained for two genes (in blue and red) and total DNA (in green), and mounted in solid plastic. This mountant closely matches the refractive index of the yolk sack (the interior of the embryo) allowing us to image all the way through. The mounted embryos are imaged whole with a Zeiss 510 laser scanning confocal microscope. Using two-photon excitation we can excite all three dyes with a single laser line; this imaging modality also diminishes light attenuation deeper in the sample and photo-bleaching. Each acquired three-dimensional image contains one whole embryo, with enough resolution to identify individual nuclei and measure the level of gene expression for each. Various "thumbnail" images decorate this page (these are downsampled projections of the 3D images).
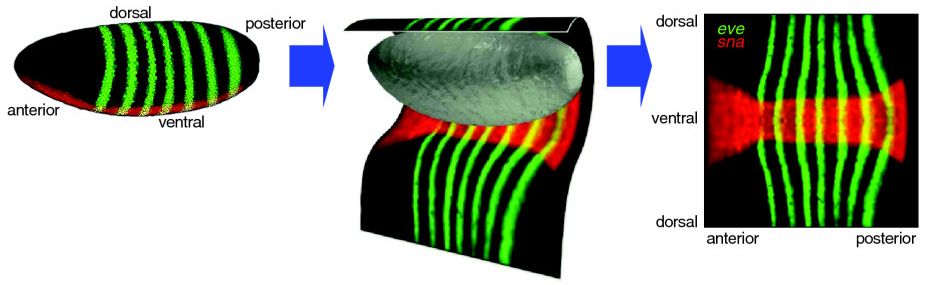
We use a cylindrical projection to show the whole blastoderm surface in a two-dimensional plot.
Each of these 0.5Gb, 3D confocal images is processed and analyzed to obtain a 1Mb text file. This file contains geometric data for each nucleus (position, volume, etc.), and the measured level of expression of the two genes. These levels are measured independently in the nucleus, the basal and the apical regions of the cytoplasm associated to each nucleus. The set of algorithms designed to accomplish this use some standard and not-so-standard techniques, and have a host of problems to overcome: signal attenuation, channel cross-talk, noise and the lower resolution along the optical axis (which is about 3 times lower in this axis than in the optical plane). This last issue requires for the algorithms to do some guessing, because the boundary between nuclei often completely disappears.
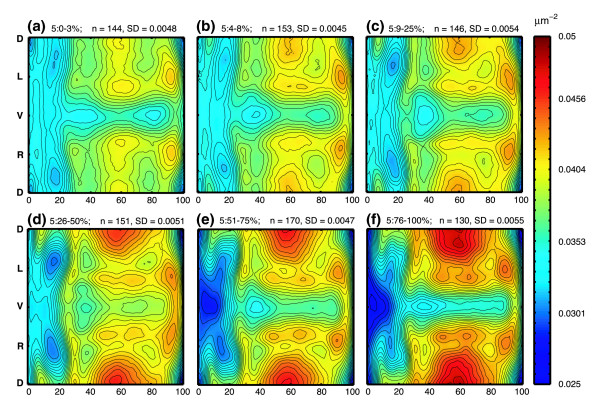
The packing density of nuclei on the surface changes significantly over the 50 minutes of stage 5.
It was known that the expression of the early regulatory genes changes rapidly and drastically during the stage we are examining. What was not known, however, is that the morphology also changes subtly. By grouping the embryos into age cohorts, dividing up developmental stage 5 into 6 intervals of roughly 10 minutes, we found significant changes in the packing density of nuclei on the surface of the embryo. This change in density implies a movement of cells that was previously unknown. Modeling gene expression without taking this movement into account must yield inaccurate results.
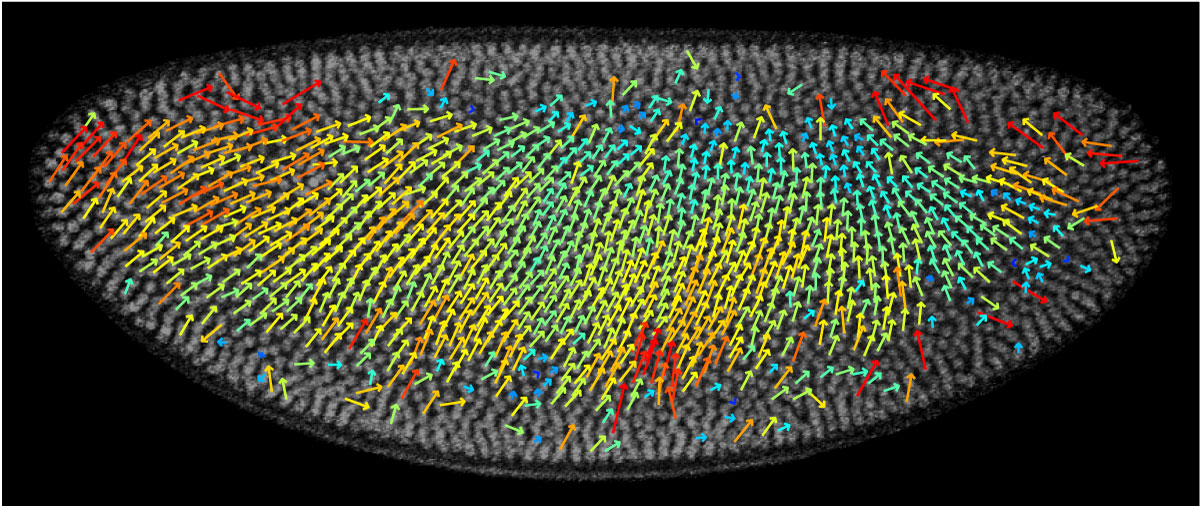
Live imaging of GFP-Histone embryos verified the nuclear movement estimated from fixed embryos.
Using the measured nuclear density, we were able to model the movement of nuclei. This model was verified with live imaging of GFP-Histone embryos, which are embryos from a genetically modified fly strain: the DNA for Green Fluorescent Protein was inserted into its genome in such a way that the animal expresses this protein together with Histone. Therefore, the embryo has nuclei that fluoresce by themselves, without the need of adding nocive chemicals. We imaged such embryos repeatedly, and were able to follow the nuclei over time, measuring how they move.
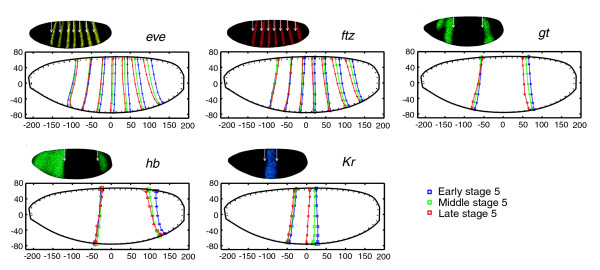
We accurately measured the location of a/p patterning stripes over time.
We also measured the location of edges of the a/p patterning genes. These genes dictate the development of a blastoderm to a maggot. We were able to separate the measured stripe movement into movement caused by movement of the cells, and movement caused by changes in expression level. The changes in expression level are the most relevant when studying the gene transcription network. These results let us to believe that the a/p and d/v patterning genes interact much earlier than previously thought. Experiments with knock-out mutants, embryos that do not express one of the genes being studied, revealed that this is indeed the case: by regulating changes in nuclear density, the d/v patterning genes influence the location of expression of the a/p patterning genes. These d/v genes dictate the different spacing of the a/p stripes along the ventral and dorsal surfaces. Previously it was thought that these differences were caused by the egg shape.
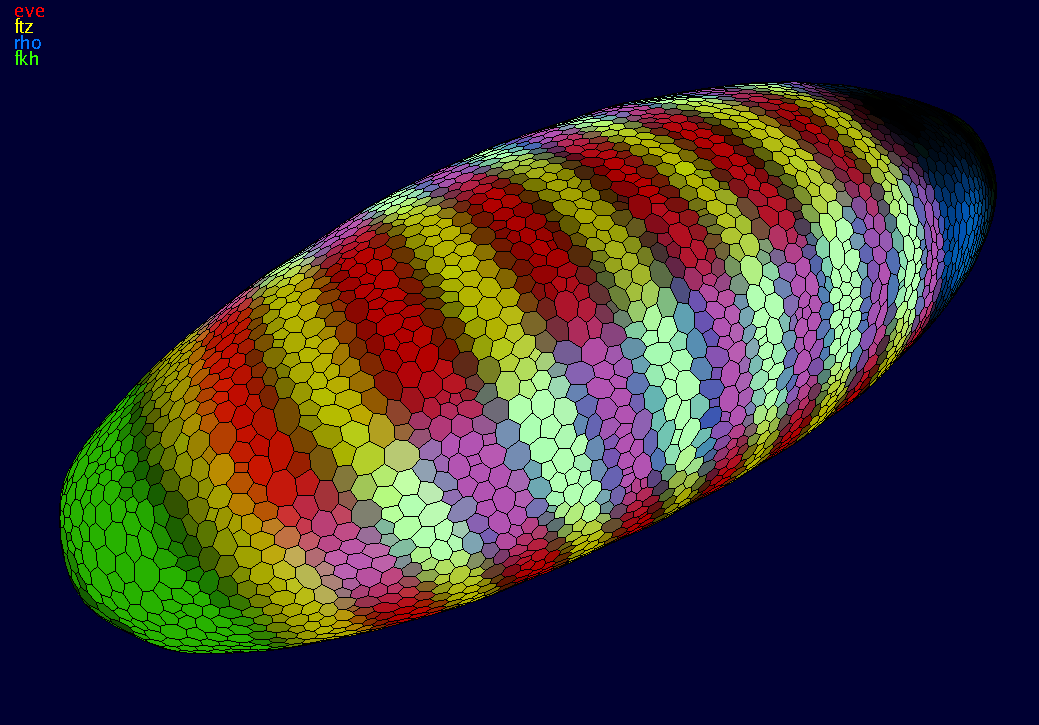
Three-dimensional view of an embryo with four gene expression patterns mapped onto it.
If one wishes to examine the interaction between two genes, one should stain one embryo for those two genes. If one wishes to examine the interaction for 30 genes, the common approach is to stain for each pair of genes, and study the pair-wise interactions. This leads to 302=900 differently stained embryos. Our approach is to stain for one marker gene and one other gene. We collect many embryos for each combination, and register all of these embryos based on the marker gene. This yields spatial correspondence between the various expression patterns as well as averaged gene expression levels for each of the genes. We can now study gene interactions with only 30-1=29 differently stained embryos.

Embryos are registered to the synthetic embryo to form the atlas.
We generated a model embryo that closely matches the average morphology of the embryos in our study. Using the previously estimated nuclear movements, this model embryo's morphology changes over time in the same way a real embryo does. Next, we registered all the measured data onto this model embryo, creating an atlas of morphology and gene expression for the stage 5 blastoderm Drosophila embryo. This atlas represents about 100 of the genes that are expressed in patterns during this stage.
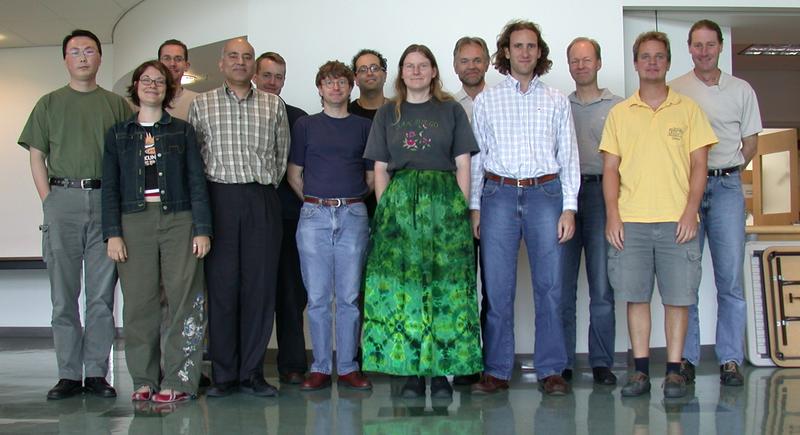
In this part of the project were working (in alphabetical order): Mark Biggin, Angela DePace, Michael Eisen, Charless Fowlkes, Bernd Hamann, Clara Henriquez, Min-Yu Huang, David Kaszuba, Soile Keränen, David Knowles, Jitendra Malik, Oliver Rübel, Lisa Simirenko, Damir Sudar and Gunther Weber.
![]()
![]() © 2006-2010 Cris Luengo
© 2006-2010 Cris Luengo
Last modified June 2, 2010.