Introduction to computerized image analysis
Segmentation
A rather obvious first step in the actual analysis of the image is to segment it, i.e., divide it into different regions. To what extent and in what way this is done is dependent on the problem to be solved. In some cases, it is enough to see study the greylevel of the pixel. We can say that all pixels with a greylevel higher than a certain threshold value is of interest, the remaining ones we do not care about. This is called thresholding of the image. To find the threshold, we often use the greylevel histogram of the image. The histogram describes how many pixels there are for each greylevel.
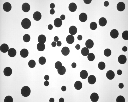
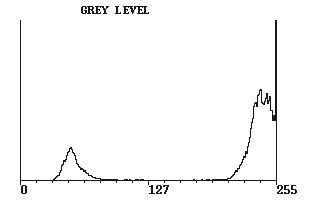
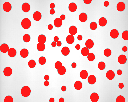
Below to the left we see an image with a number of black discs on. To the right of it we see the histogram for the same image. We have two peaks in the histogram. One corresponds to the background in the image, the light parts, and the other to the discs, the dark parts. To threshold the image, we say that all pixels with a greylevel less than 127 should belong to the interesting region and the remaining should not. The result of this process is the image to the right, where red means interesting. The interesting region is what we will use in our analysis. From the histogram we see that the value 127 is not very critical. It would work equally well using a slightly lower or higher threshold.
 |
 |
 |
| Discs |
Histogram of the image |
Segmentation |
In the segmented image we see that the interesting region consists of a number of individual discs but also of groups of discs that are connected to each other. By studying how the pixels are placed with respect to each other, the computer can divide the interesting region into parts of connected pixels. Each part is assigned a label in the computer. Such a division is often referred to as labelling.


