- New Objective Quantitative Analysis Techniques for Quantification of Tissue Regeneration Around Medical Devices
Hamid Sarve, Joakim Lindblad, Vladimir Curic, Gunilla Borgefors
Partners: Carina Johansson, Dept. of Clinical Medicine, Örebro University; Nataša Sladoje, Faculty of Engineering, University of Novi Sad, Serbia
Funding: Swedish Research Council; S-faculty, SLU
Period: 0503-
Abstract: With an aging and increasingly osteoporotic population, bone implants are becoming more important to ensure the quality of life. In order to evaluate how tissue reacts on implants, the interface at the implant and tissue must be studied. Today, this is done manually in a microscope which is a costly and time-consuming procedure.
The aim of this Project is to develop automatic image analysis methods for evaluating images of implant in situ. These methods would provide faster and more objective measurements on how well the implant is integrated in the bone compared to today's manual methods. The analysis involves segmentation of the images into different tissue-types and measures such as bone contact length, area and volume.
The Project encompasses parallel development and comparison of methods for 2D analysis of histological sections as well as 3D analysis of SRCT volumes. To facilitate comparison of results from the two imaging modalities, a 2D-3D registration method has been developed. During 2009, methods for segmentation and feature extraction of 3D volume data were developed. Segmentation methods for the 2D histological sections were further improved using a fuzzy set framework. This progress was presented in two publications at the 16th Scandinavian Conference on Image Analysis (SCIA'09). See Figure 4.
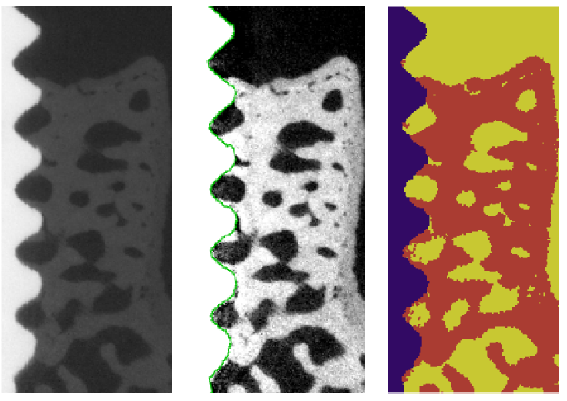
Figure 4:
(Left) A slice from the SRµCT image volume (middle) Artifact corrected slice with the interface region marked and the implant in white to the left (right) A slice from the segmented image volume, showing three classes: the bone
(red), the soft tissue (yellow) and the implant (blue).
|
|
- Assessing Bone Implant Integration From Synchrotron micro-CT Data
Hamid Sarve, Joakim Lindblad, Gunilla Borgefors
Partners: Carina Johansson, Dept. of Clinical Medicine, Örebro
University; AstraTech, Mölndal
Funding: The Knowledge Foundation
Period: 0906-
Abstract: This Project aims to develop new techniques for interactive 3D visualization of bone anchored implants, in order to facilitate improved understanding of the mechanisms of implant integration. To enable good communication between the people involved in development, production and use of medical devices - computer scientists, material scientists, and medical doctors - each with their own special knowledge, it is of highest importance to provide a common visual platform for a mutual understanding of the problems of implant integration. Being able to actually see the 3D structure around the implant for the first time will no doubt inspire new measures of the implant integration quality.
We base the visualization on data from non-destructive 3D SRCT imaging; this technique yields more accurate tomographic reconstruction at higher resolution compared to standard CT. Furthermore, SRCT-imaging is more suitable for samples containing metal as the artefacts caused by the metal is significantly lower compared to traditional CT. Initial tests show that existing visualization software is rather useless for this type of complex and highly detailed data, requiring the development of special purpose methods and software.
The combination of this Project and Project 8 will improve both quantitative and qualitative analysis of bone implant integration and thereby support the development of more effective implants and diminish the number of malfunctioning devices.
- Analysis of Rat Embryo Heart Activity
Khalid Niazi, Ewert Bengtsson
Partners: Mats Nilsson, Div. of Toxicology, Dept. of Pharmaceutical Biosciences, UU
Funding: COMSATS IIT, Islamabad
Period: 0711-0908
Abstract: Embryo cultures of rodents is an established technique for monitoring adverse effects of chemicals on embryonic development. The assessment involves determination of the heart rate of the embryo. We have modeled the movement of the heart as a sinusoid and developed a method to represent the heart motion as a function of time. Analysis of the heart beats were carried out using Emperical Mode Decomposition (EMD).
EMD is a powerful data analysis technique which decomposes any complicated signal into intrinsic mode functions (IMF). EMD is usually combined with Hilbert transform to analyze the instantaneous frequency in non-stationary signals. This combination is commonly referred as Hilbert-Huang Transform (HHT). In this Project, we have used EMD with slight modification to detect periodic activity in rat embryo's heart. The normal embryo's heart activity can easily be detected by local maxima detection but it becomes a challenging task once the heart activity becomes abnormal.
EMD decomposes the signal into different IMF functions; where each IMF function is believe to capture different frequency range. It is different from Fourier transform and Wavelet transform in the sense that it has got adaptive basis. Fourier transform relies on Cosine basis and requires a number of cutoffs if one needs to decompose a signal using a Fourier transform. Wavelet transform requires the selection of mother wavelet, and also the level of decompositions which is one of the most difficult tasks if one wants to automate a process. On the other hand, EMD generates the IMF functions from the underlying signal making it adaptive in nature. We have exploited this property to denoise the complicated signal which has resulted in easy detection of maxima during abnormal heart activity.
- Scoring of Developmental Stages of Morphological Features of Rat Embryos
Khalid Niazi, Ewert Bengtsson
Partners: Mats Nilsson, Prof. Lennart Dencker, Div. of Toxicology, Dept. of Pharmaceutical Biosciences, UU
Funding: COMSATS IIT, Islamabad and Swedish Research Council
Period: 0909-
Abstract: The whole embryo culture assay is endorsed as one of few good in vitro embryotoxicity assays available. The goal of the Project is to improve the objectivity and sensitivity in the measurements with the help of image and data analysis methods in the assay using three clinical relevant anti-epileptic drugs as model embryotoxicants.
The scoring methods used for morphology are generally semi-quantitative (categorical, score ) and mainly associated with growth rate. Specific malformations are scored as either absent (=0) or present (=1). We propose to complement existing scoring systems that will improve embryotoxicity comparisons between labs and enable the creation of a database with cross-reference ability to molecular biology data and to automated image analysis system. Currently we are focused on extracting different morphological features during the development of rat embryos.
- Automated Localisation of Macromolecules in Cryo Electron Tomographic Data
Stina Svensson, Magnus Gedda
Partners: Dept. of Cell and Molecular Biology (CMB), Karolinska Institutet, Stockholm
Funding: The Swedish Research Council (Project 621-2005-5540); SLU S-faculty; UU TN-faculty
Period: 0401-
Abstract: State of the art imaging techniques makes it possible to study individual proteins and other macromolecules from a structural point of view. Descriptions with respect to geometry and shape facilitates studying protein dynamics. This type of study is essential to increase the understanding of their biological role. CMB has developed methods, using cryo electron tomography (Cryo-ET), for 3D imaging of individual proteins at a resolution of a few nm. Localisation of the protein in the image has so far been done manually. For large-scale studies, computerized image analysis serves as an essential tool to automatically and objectively analyse image content. In this Project, we develop methods to automatically localise macromolecules from in vitro Cryo-ET images and thereby make large-scale studies of proteins possible. This is done by taking into account both grey-level information (which reflects the internal structure of the protein) and 3D shape information.
Earlier in the Project we have built a system to localise proteins which consist of a set of roundish subunits of equal size and proteins which consist of one elongated and one roundish subunit. During 2009 we have evaluated the various aspects of the system in a controlled environment using simulated data. The simulated data were produced by constructing phantoms from the Protein Databank (PDB) and running them through a transmission electron microscopy (TEM) simulator.
- Segmentation and Analysis of Point-like Fluorescent Signals in 2D and 3D Images of Cells
Amalka Pinidiyaarachchi, Amin Allalou, Carolina Wählby, Ida-Maria Sintorn
Partners: Malin Jarvius, Chatarina Larsson, Carl-Magnus Clausson, Katerina Pardali, Ola Söderberg, Irene Weibrecht, Mats Nilsson, Agata Zieba, Dept. of Genetics and Pathology, UU
Funding: EU-Strep Project ENLIGHT; SIDA
Period: 0305-
Abstract: The interior of a cell is elaborately subdivided into many functionally distinct compartments, often organized into intricate systems. One way of studying such compartments is by the use of different fluorescent markers that bind specifically to the objects of interest, in this case padlock- and proximity probes. This type of staining followed by imaging through a fluorescence microscope results in point-source signals, together with compartment-specific stains, background noise and autofluorescence. 3D images are acquired by making non-invasive serial optical sections of the object. Analysis of spatial relationships in 2D and 3D requires pre-processing followed by signal detection and segmentation of cell compartments combining intensity and shape information. During 2009 a paper describing a method of detecting signals in 3D was published (Allalou et al, Cytometry part A). Once the signals are detected, the goal is to analyze spatial relationships and non-random patterns in the signal distribution. Sometimes images have large number of signals that are clustered together. This poses a problem in the detection of signals, and an initial investigation has been made on how to resolve this issue.
- Image Based Measurements of Single Cell mtDNA Mutation Load
Amin Allalou, Carolina Wählby
Partners: Anton K. Raap, Frans M. van de Rijke, Roos Jahangir Tafrechi, Dept. of Molecular Cell Biology, Leiden University Medical Center, The Netherlands; Visiopharm, Hörsholm, Denmark
Funding: EU-Strep Project ENLIGHT, Swedish Research Council
Period: 0608-0907
Abstract:
Cell cultures as well as cells in tissue always display a certain degree of variability, and measurements based on cell averages will miss important information contained in a heterogeneous population. An automated method for image based measurements of mitochondiral DNA (mtDNA) mutations in individual cells has been implemented and integrated as a part of the VIS image analysis platform. The methods are used on a daily bases in the continued work on mutation load analysis at Leiden University Medical Center in the Netherlands. The development of image based single cell analysis will continue to be in focus also after the ENLIGHT Project.
- Quantification and Localization of Colocalization
Milan Gavrilovic, Carolina Wählby
Funding: EU-Strep Project ENLIGHT
Period: 0611- 0907
Abstract: In fluorescence microscopy, during image acquisition of
multiply labeled specimen, two or more of the emission signals can
often be physically located in the same area or very near to one
another in the final image due to their close proximity within the
microscopic structure. This is known as colocalization. Colocalization
is particularly important for revealing information on how and where
bio-molecules such as proteins and protein complexes interact within a
cell, as well as in which sub-cellular structures they are present. If
red and green fluorochromes are selected colocalization will appear as
yellow emission. Existing methods for quantification and localization
of colocalized pixels have been implemented and compared. We show that
robustness of detection of colocalization can be improved by
separating color information from intensity information. Color can
then be represented using an angle histogram, created by compensating
for discretization noise. Standard methods for histogram-based
classification are thereafter applied to detect red, green, and
colocalized pixels.
- Blind Spectral Unmixing in Fluorescence Microscopy
Milan Gavrilovic, Carolina Wählby
Funding: EU-Strep Project ENLIGHT; TN-faculty, UU
Period: 0901-
Abstract: Background fluorescence, also known as autofluorescence, and
cross-talk are two problems in fluorescence microscopy that stem from
similar phenomena, often solved by spectral unmixing. When biological
specimens are imaged, the detected signal often contains contributions
from fluorescence originating from sources other than the imaged
fluorophore. This fluorescence could either come from the specimen
itself (background fluorescence), or from fluorophores with partly
overlapping emission spectra (cross-talk or bleed-through). In order
to resolve spectral components at least two distinct wavelength
intervals have to be imaged or used for excitation. To perform
classical spectral unmixing, spectral signatures, a representation of
the emission spectra, need to be recorded beforehand for all relevant
fluorophores. In situations when spectral signatures are unknown, the
method based on spectral decomposition is employed for extraction of
parameters for blind linear or nonlinear spectral unmixing. The
algorithm also saves time and space for storage of multispectral
images as only two channels need to be recorded and processed.
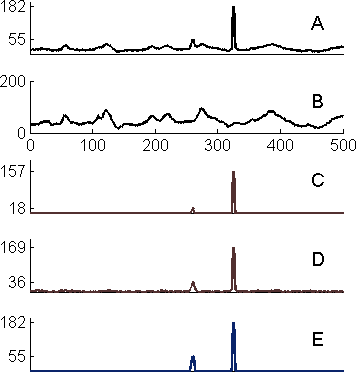
Figure 5:
An example taken from the study of protein complex formation in brain
tissue. Intensity distribution over one spatial dimension shows: (A)
two signals over the background (one weak and one strong); (B)
background; (C, D) the result of linear unmixing with two different
parameter settings - either the weak signal is suppressed or
fluorescence background is not completely suppressed; (E) the result
of nonlinear unmixing indicating that original signal intensities were
preserved and background completely suppressed.
|
|
- Spectral Image Analysis in Biomedical Applications
Milan Gavrilovic, Carolina Wählby
Partners: Irene Weibrecht, Tim Conze, Malin Jarvius, Ola Söderberg,
Ulf Landegren, Dept. of Genetics and Pathology, UU
Funding: EU-Strep Project ENLIGHT; TN-faculty, UU
Period: 0807-
Abstract: Methods developed in Projects 15 and 16 were applied in a variety of
biological applications in cooperation with Molecular Tools group at
the Dept. of Genetics and Pathology. One application of the
method for detection of colocaliziation deals with detection of double
and single coloured point-like fluorescent signals. The aim is precise
quantification of DNA-protein interactions that could help biologists
deciding if a gene is missregulated in a disease or how a certain
treatment affects the expression of a target gene. In a similar
biomedical application of image analysis methods, angle histograms are
used to estimate the quality in oligonucleotide production. We were
recently investigating differences between synthetic oligonucleotide
probes and enzymatically prepared clones. Finally, algorithms for
blind spectral unmixing were used for automated suppression of
background fluorescence due to presence of lipofuscin and hemoglobin
in brain tissue. Fig. 5 shows the result of background suppression and amplification of the true signals.
- Monitoring Cell Growth by Wavelet Based Texture Classification
Amalka Pinidiyaarachchi, Carolina Wählby
Partner: Hans Claesson, Histogenics Corporation, Waltham, MA, USA.
Funding: SIDA IT-Project
Period: 0806-0904
Abstract: Monitoring cell confluence is valuable for optimization of cell culture parameters and cell harvest. In this Project, we are developing an automatic method for quantifying cell confluence of a time sequence of fibroblasts imaged using phase contrast microscopy. Using wavelet based texture features we classify images into regions consisting of interphase cells and proliferating and/or necrotic cells. The results agree with direct observations of the cell culture and the method shows the potential of being part of an automatic cell culturing system indicating when the cells have reached the desired level
of confluence. The ability to detect necrosis also provides a warning system that indicates if the cultures are failing.
- Parallax Error Correction in Retinal Image Registration
Khalid Niazi, Bettina Selig, Ewert Bengtsson, Ingela Nyström
Partners: Albert Alm, Dept. of Neurosciences, Ophthalmology at UU
Funding: COMSATS IIT, Islamabad
Period: 0711-
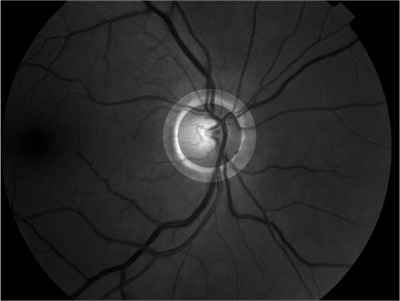
Abstract: Retinal imaging is one of the main sources in ophthalmology to study the optical nerve head and the retina. Retinal images are often used for analyzing, diagnosing and treating a number of diseases of the human retina. Image registration plays an important role in determining the progression of retinal illness. In the current Project, we are developing a method which will help in evaluation of glaucoma progression. We are especially concentrating on correction of parallax error, which is normally produced due to a change in the angular position of the camera.
Retinal image registration can be performed between either the full images or within sub-regions. The movement of vessels makes it illogical to perform registration between full images. Using a sub-region which is least effected by vessel movement will present a true picture of the vessel movement. The vessels inside the optic disc, which lie close to the origin, move with time and often get overexposed during imaging. It has also been reported that the end of the vessel gets detached from the surface of the retina due to loss of the nerve fibers which leaves us to use the area around the border of the optic disc as shown in Figure 6 for registration. Retinal images are normally suffering from noise. We have used bilateral filtering for noise removal. Bilateral filtering is well-known to reduce noise while preserving the edges at the very same time. This process is followed by edge detection which is performed using first order absolute moment (FOAM). FOAM is good at edge detection and localization but is very sensitive to noise. Preprocessing by bilateral filtering makes FOAM an ideal candidate for edge detection. In order to detect the optical disc boundary, a snake is initialized at the image border, where the edge image will serve as potential function for the snake. The introduction of bilateral filtering and FOAM has given us the freedom to initialize the snake quite far away from the optical disc. Thereafter a sub-region is defined automatically around the optic disc as shown in Figure 6.
Figure 6:
The superimposed circular sub-regions are used for registration.
[Reference image]
[Floating image] 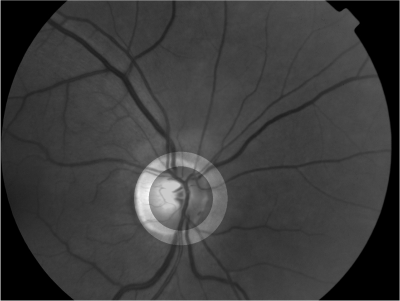
|
We have successfully used particle swarm optimization (PSO) for area-based registration of these sub-regions. The study has also resulted in development of a modified version of PSO. The modified version utilizes benefits from the Gaussian and the uniform distribution, when updating the velocity equation in the PSO algorithm. Which one of the distributions is selected depends on the direction of the cognitive and social components in the velocity equation. This direction checking and selection of the appropriate distribution provide the particles with an ability to jump out of local minima. The registration results achieved by this new version proves the robustness and its ability to find a global minimum.
- Identification of Highly Pathogenic Viruses in Transmission Electron Microscopy Images
Gustaf Kylberg, Ida-Maria Sintorn, Ewert Bengtsson, Gunilla Borgefors
Partners: Vironova AB; Ali Mirazimi, Kjell-Olof Höglund, Centre for
Microbiological Preparedness; Swedish Institute for Infectious Disease Control (SMI)
Funding: Swedish Emergency Management Centre (KBM), Swedish Defense
Materiel Administration (FMV), Swedish Agency for Innovative Systems
(VINNOVA)
Period: 0801-
Abstract: This Project aims at automating the virus identification
process in high resolution TEM images and thereby creating a rapid,
objective, and user independent virus diagnostic system. The task
consists of method development for segmenting virus particles with
different shapes and sizes in high magnification images, see Figure 7,
and extracting descriptive features to enable classifying the virus
species. The automatic acquisition process of high magnification
images is developed in Project 21. The Project was presented orally at
the 6th International Symposium on Image and Signal Processing and
Analysis (ISPA) in Salzburg, Austria.
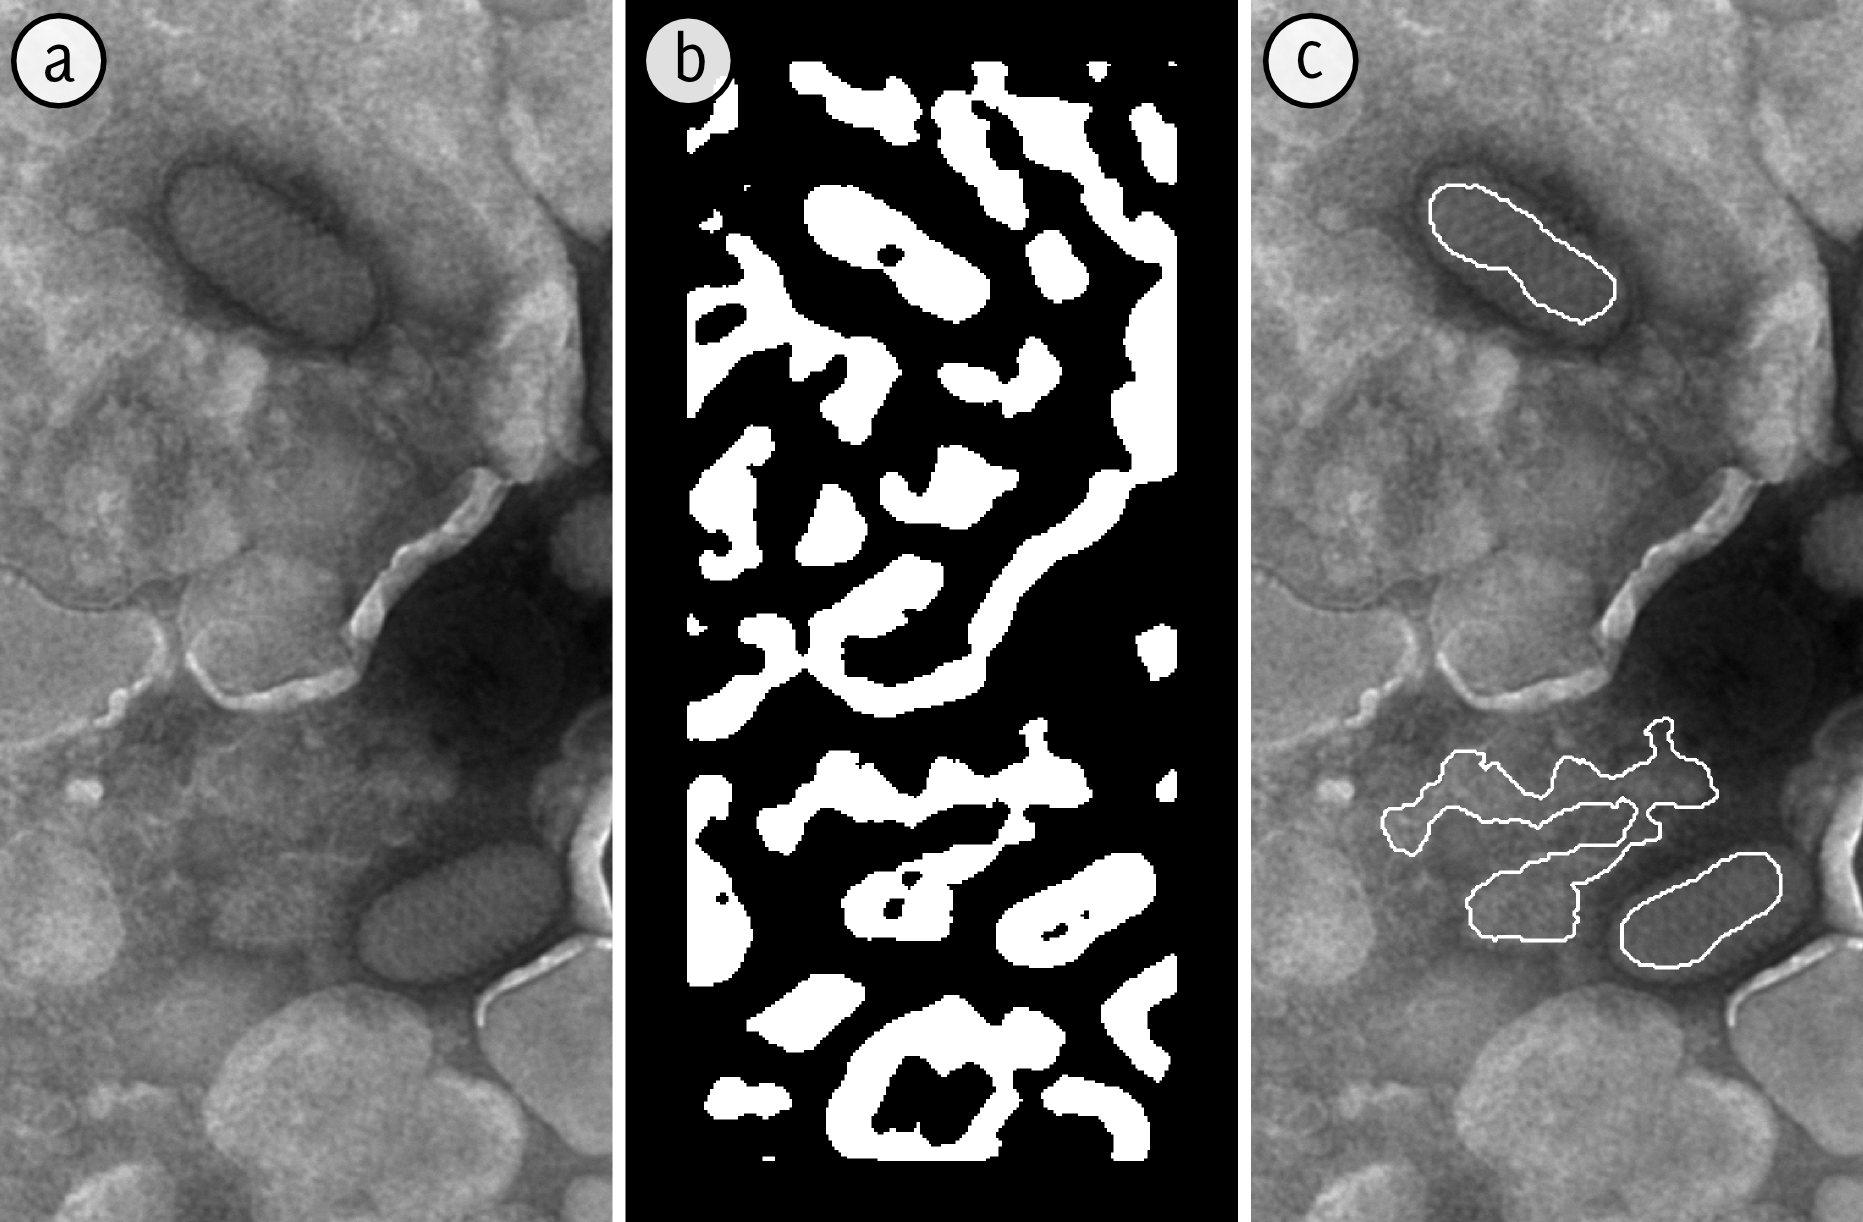
Figure 7:
A sample result of the local intensity based segmentation
method. a) original image, b) segmentation and c) final,
postprocessed, segmentation result overlaid on the original image. The
two ovals, top and bottom, are viruses.
|
|
- Detection of Regions of Interest for Automated Image Acquisition
in Virus Diagnostics
Gustaf Kylberg, Ida-Maria Sintorn, Ewert Bengtsson, Gunilla Borgefors
Partners: Vironova AB; Ali Mirazimi, Kjell-Olof Höglund, Centre for
Microbiological Preparedness; Swedish Institute for Infectious Disease Control (SMI)
Funding: Swedish Emergency Management Centre (KBM), Swedish Defense
Materiel Administration (FMV), Swedish Agency for Innovative Systems
(VINNOVA)
Period: 0801-
Abstract: Transmission electron microscopy (TEM) is an important virus
diagnostic tool. The main drawback is that an expert in virus
appearance in electron microscopy is needed to perform the search for
virus particles and identification at the microscope. Especially the
search for virus particles is often a very time consuming task.
This Project aims at identifying regions likely to contain viruses in
low magnification images to enable automation and making the image
acquisition process more efficient. This is one step towards
automating the diagnostic process and thereby creating a rapid,
objective, and user independent virus diagnostic system. Using our
region identification, we can concentrate the analysis on only 0.01%
of the total sample area. The subsequent segmentation and
classification process is developed in Project . The Project was
presented orally at the 16th Scandinavian Conference on Image Analysis
(SCIA) in Oslo, Norway.
- Analysis of Virus Morphology in Electron Microscopy Images
Ida-Maria Sintorn
Partner: Vironova AB
Funding: VINNMER programme, Swedish Agency for Innovative Systems
Period: 0801-
Abstract: Electron Microscopy allows for studying virus morphology at the nm level. This means that structural differences between virus maturation stages, related virus species, wild type virus and virus treated with a potential drug or a small molecule can be analyzed. Both external (shape and protein patterns on the virus surface) and internal structural differences can be analyzed. In this Project methods for identifying and quantifying such structural differences are developed.
- High Content Analysis (HCA) Method Development for Cellular Screening
Ida-Maria Sintorn
Partners: Adrian Baddeley, Michael Buckley, Leanne Bischof, CSIRO Mathematical and Information Sciences, Australia, Stephen Haggarty, Broad Institute of Harvard and MIT, USA
Funding: SLU, VINNMER programme, Swedish Agency for Innovative Systems
Period: 0901-
Abstract: In biological research and in the drug development process when screening for new drugs, HCA systems are often used. Such a system is a fully automatized microscopy system that acquires hundreds or thousands of images in an experiment and automatically extracts information from the image data. In this Project we develop pre-processing tools to allow for improved comparison of image content within and across cellular screening experiments. We also develop methods and new statistical analysis tools for so called co-culture HCA experiments i.e., when more than one celltype are cultured together to allow for investigating their interaction in response to added substrates.
- A Multidisciplinary Approach to Establish Mechanisms for Mitochondrial DNA Segregation in Human Disease
Amin Allalou and Carolina Wählby
Partners: Nils-Göran Larsson, Karolinska Institute; Mats Nilsson, Dept. of Genetics and Pathology, UU
Funding: The Swedish Research Council, Collaboration Grant, Medicine
Period: 080101-
Abstract: Mutations of mitochondrial DNA (mtDNA) cause genetic syndromes with widely varying phenotypes and are also implicated in many age-associated diseases and the ageing process itself. Our knowledge of the principles governing segregation of mtDNA mutations in somatic tissues and in the germ line is very limited. In this collaborative Project we combine a powerful technique for detection of individual mtDNA molecules with image analysis. We work with a variety of mouse models and the goal is to develop image analysis software to do three-dimensional (3D) reconstruction of the distribution of mutated mtDNA molecules in mammalian tissues. We want to use this technology to study segregation of mtDNA mutations in mouse tissues and to study the mtDNA bottleneck by visualizing the distribution of mutated mtDNA during oogenesis. The ultimate goal is to study the distribution of mtDNA mutations in embryos and placenta to establish principles for prenatal diagnosis.
- Combating Breast Cancer by Digital Pathology
Andreas Kårsnäs, Robin Strand, Ewert Bengtsson, Stefan Seipel
Partners: Visiopharm, Hörsholm, Denmark and Clinical Pathology Division, Vejle hospital, Vejle, Denmark
Funding: NordForsk Private Public Partnership PhD Programme and Visiopharm
Period: 0909-
Abstract:
The results of analyses of tissue biopsies by pathologists are crucial for breast cancer patients. In particular, the precision of a patient's prognosis, and the ability to predict the consequences of various treatment opportunities before actually exposing the cancer patient, depend on the detection and quantification of biomarkers in tissue sections by microscopy.
Experience from the last decade has revealed that manual detection and quantification of biomarkers by microscopy of tissue biopsies is highly dependent on the competencies and stamina of the individual pathologist. The aim of the present PhD Project is to develop software-based algorithms, which can facilitate the workflow and ensure objective and more precise results of the quantitative microscopy procedures in breast cancer.
During the fall 2009, some initial steps have been taken to develop and evaluate user interfaces supporting pathologists and ensuring objective and more precise results of the quantitative microscopy procedures in breast cancer. In collaboration with Vejle hospital and Visiopharm, a method for determining the possibilities to automatically analyze the proliferation rate of cancer cells using color segmentation has been developed.
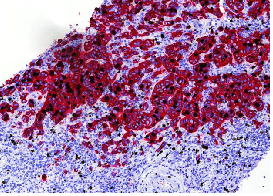
Figure 8:
Sample of sentinel lymph node stained for analyzing the proliferation rate of cancer cells. This specific staining is a Immunohistochemic double-staining using Ki-67 and KL-1.
|
|
- Automatic, Quantitative Malignancy Grading of Prostate Cancer using Image Analysis
Ingrid Carlbom, Ewert Bengtsson
Partners: Christer Busch, University Research Hospital, Uppsala, Marene Landström, University Research Hospital
Funding: Swedish Research Council
Period: 090415-
Abstract: The goal of this Project is to replace subjective diagnosis of prostate cancer with automatic severity grading using image analysis. This will be done by combining methods for tissue staining with image analysis methods that makes it possible to distinguish cancer from normal tissue and to extract morphological features that are linked to aggressive cancer. An objective quantitative method would greatly improve prognostication and provide a firm basis for selecting the best possible course of treatment for each patient. During 2009 we secured three years of funding from the Swedish Research Council.